In order to utilize the budget analysis, clients must be invited to access their Client Portal, and must use account aggregation to link at least one bank account or credit card to the plan that is feeding in transactions.
To learn more, click here.
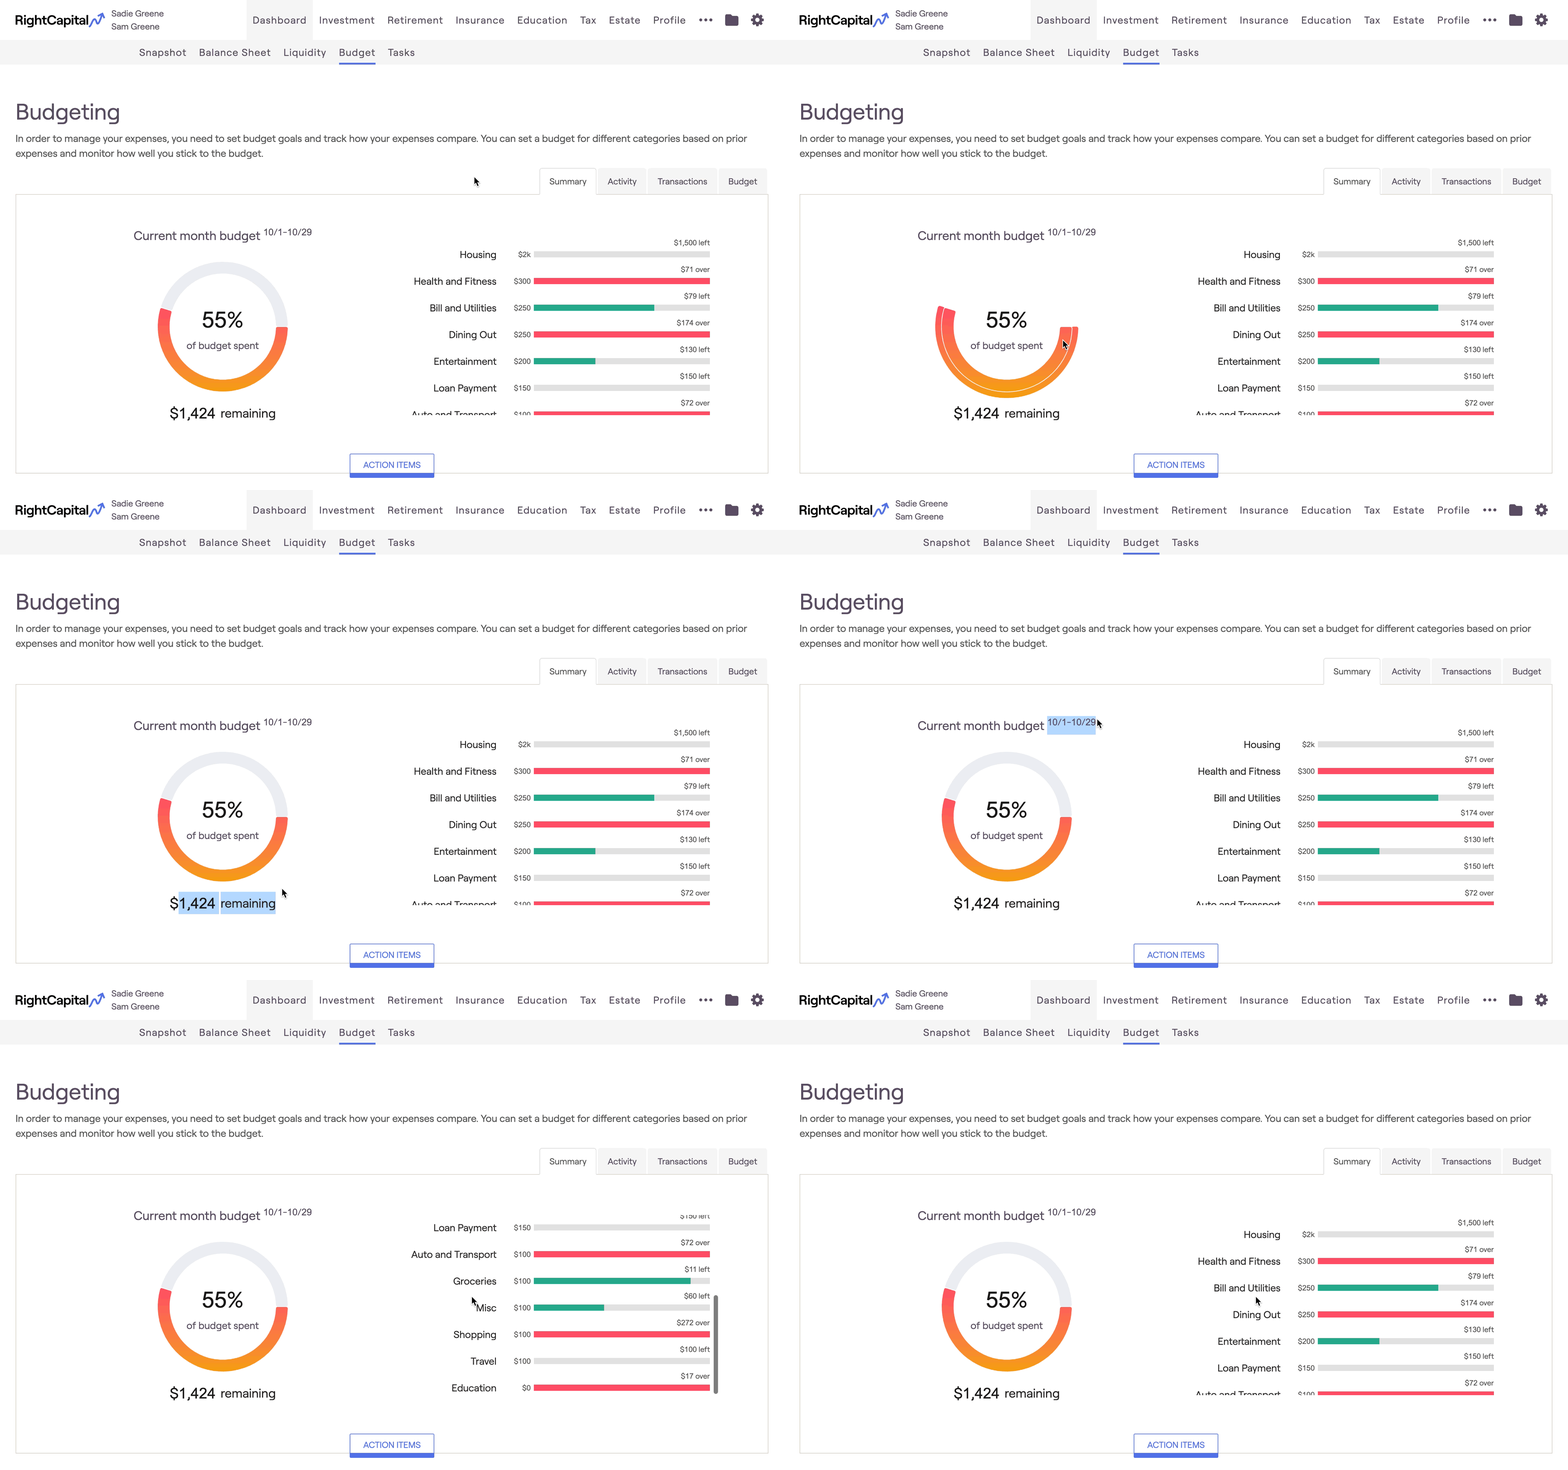
The pie chart on the left side of the page will highlight the client's overall budget progress for the month, and the list to the right will detail how over or under their spending is in any one budget category.
The bar will turn yellow when a client is close to exceeding their budget for a given category. When the client exceeds their monthly budget, the bar will turn red. This allows you and the client to track spending for each category, and quickly identify areas where the client is overspending.