Action Items

Please see the article below for a comprehensive overview of the Action Item functionality, including proposing changes, implementing strategies, and adding new items:
Create Additional Proposals
Please see the article below for a comprehensive overview of creating and working with multiple proposed plans:
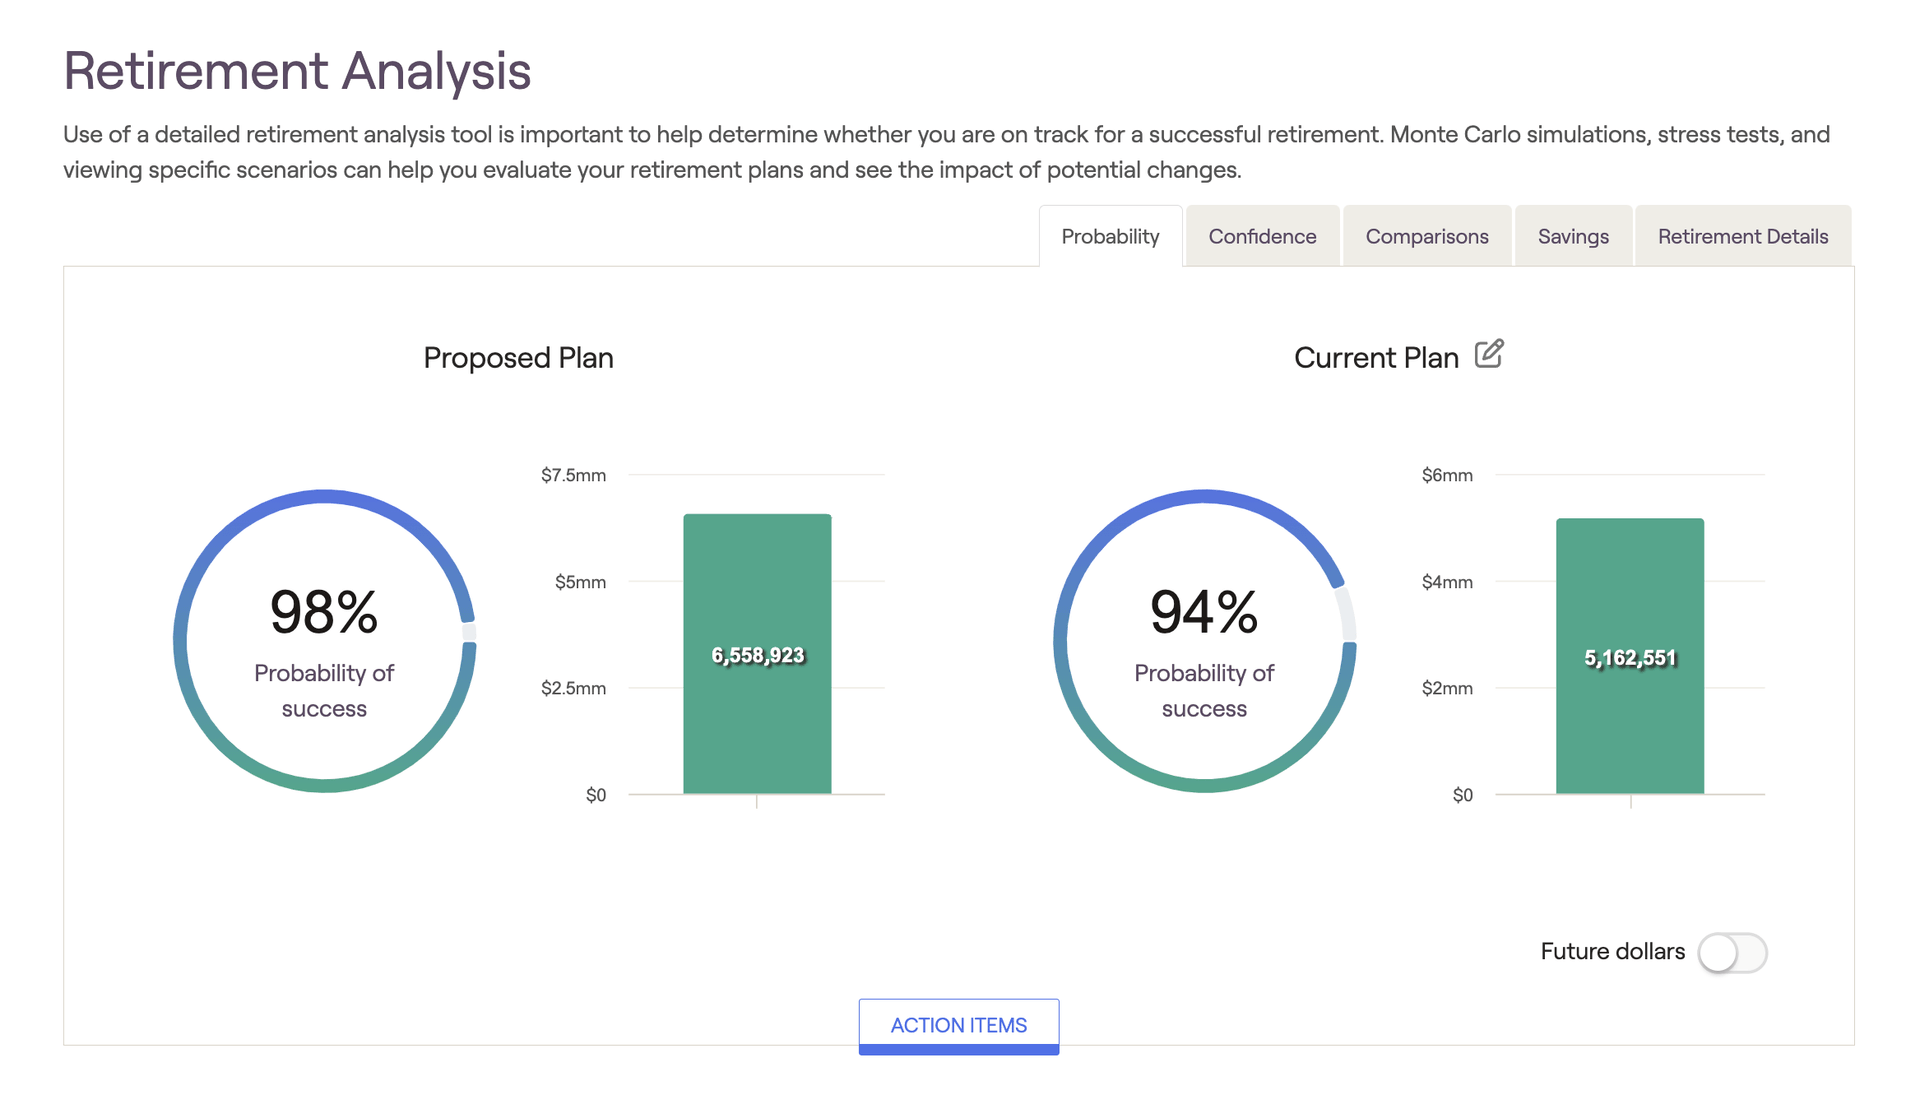
Probability of Success
The probability of success is based on a Monte Carlo simulation that runs a client's plan through 1,000 trials. The simulation factors varying levels of market volatility into each and every trial to create a comprehensive range of potential outcomes. The probability of success demonstrates the percentage of those trials that are successful, i.e. the trials that do not run out of money at any point during the client's plan.
Even if the simulation registers assets remaining in the last year of their plan, the overall probability of success will decrease if there are any years in which the simulation reports $0 within their projection. This can be best visualized by using the Confidence chart in the tab to the right of Probability (more on this here).
While it is difficult to pinpoint a universal percentage that qualifies as a "good" probability of success, 80% is often cited as a standard benchmark for a reasonable PoS%. That being said, there are various schools of thought when it comes to interpreting Monte Carlo, and in many cases the "target" probability of success is highly dependent on a client's age and willingness to make adjustments in the case of poor markets or unforeseen circumstances. Please feel free to use and interpret RightCapital's Monte Carlo analysis in accordance with your own perspective and advising philosophy.
Median Ending Invested Assets
The value in the green bar chart next to each PoS% reflects the ending invested asset value for the median Monte Carlo trial. While the median (also referred to as trial 500) only represents one possible outcome of many, this trial represents the "middle outcome" and is therefore a useful frame of reference. The median trial is visualized as a solid blue line within the Confidence chart:
By default, values displayed in the Retirement Analysis are "future" dollars. Future dollars illustrate the real projected dollar value in future years, factoring in all growth, inflation, and annual increase rates.
However, you can toggle from future dollars to "today's" dollars at any time using the toggle in the lower right of the chart/visuals. With today's dollars selected, RightCapital will discount the values calculated by your general inflation rate, which can help put things into perspective for you and your clients (especially for younger clients with long plan durations):


