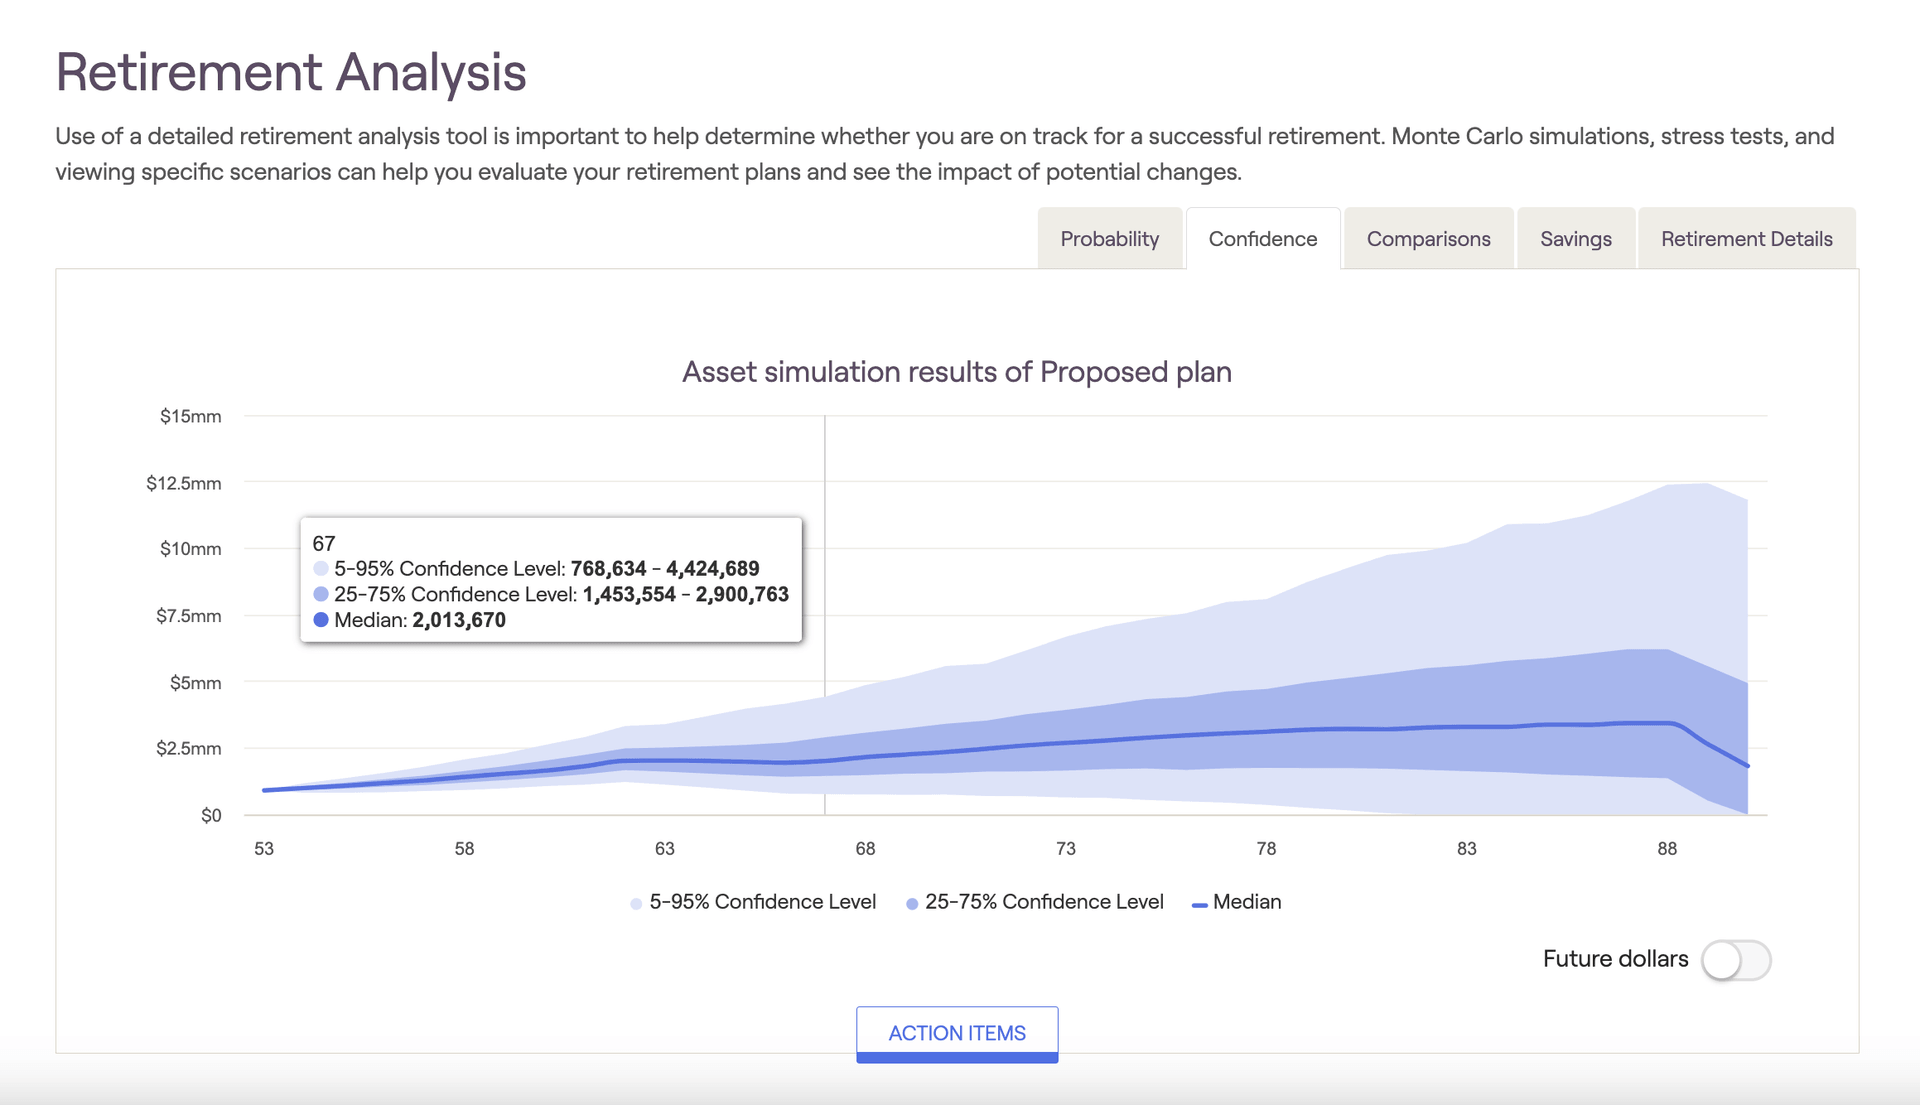
The Confidence tab is the second of five sub-tabs available within the Retirement > Analysis module. This tab provides a visual representation of the Monte Carlo analysis, reflecting the range of outcomes throughout the projection. Hovering your mouse over the chart allows you to see dollar values for each year:
Put simply...
A client's assets will most likely fall somewhere in one of the blue-shaded areas. The lightest blue covers the widest range of possibilities, which means that there is a high degree of confidence a client will land somewhere in that range (90% of results). But it can be hard to plan a lifestyle around such a large bandwidth! The darker blue area is still likely and easier to plan around (50% of results, clustered around the median, are captured by the darker blue band). The solid blue line is the median - possible, but likely not exact.
At each age (reflected on the x-axis), the 1,000 Monte Carlo trials are ordered by asset value. For the 5-95% Confidence Level, only the highest and lowest 5% of the values are excluded. So, the results of trials 51 - 950 (in asset value order) are reflected within the light blue shaded area in the confidence chart. This means that 90% of the time, a client's assets will fall somewhere between the upper and lower boundary of the light blue area. The 25-75% confidence range reflects trials 251 - 750, and the Median reflects "trial 500".
Median
Many clients often latch onto the median value as their expected retirement value at any given point. However, at best, this only has a 1/1,000 chance of being exactly true! Some successful advisors carefully disclose both the reality of a simulation ("we can't know the future until we're there") and the reality of probable range over exact value.
Using the legend underneath the chart, you can toggle the displayed values and zero in on a specific confidence interval. As a reminder, the dollar value for the median trial in the final year of the plan is the Median Ending Invested Asset value- this will align with the value displayed within the green bar graph in the Probability tab.
Contact Us
For additional assistance within RightCapital please contact our Support team.
Educational Webinars
RightCapital is committed to enabling your success. Each week, we cover essential planning modules and product updates.
RightCapital in Action
Check out our YouTube channel where we highlight Advisor Success Stories and share more Tips & Tricks!