If either the client or co-client is already retired, only the Current Year Savings chart will be available.
Current year savings
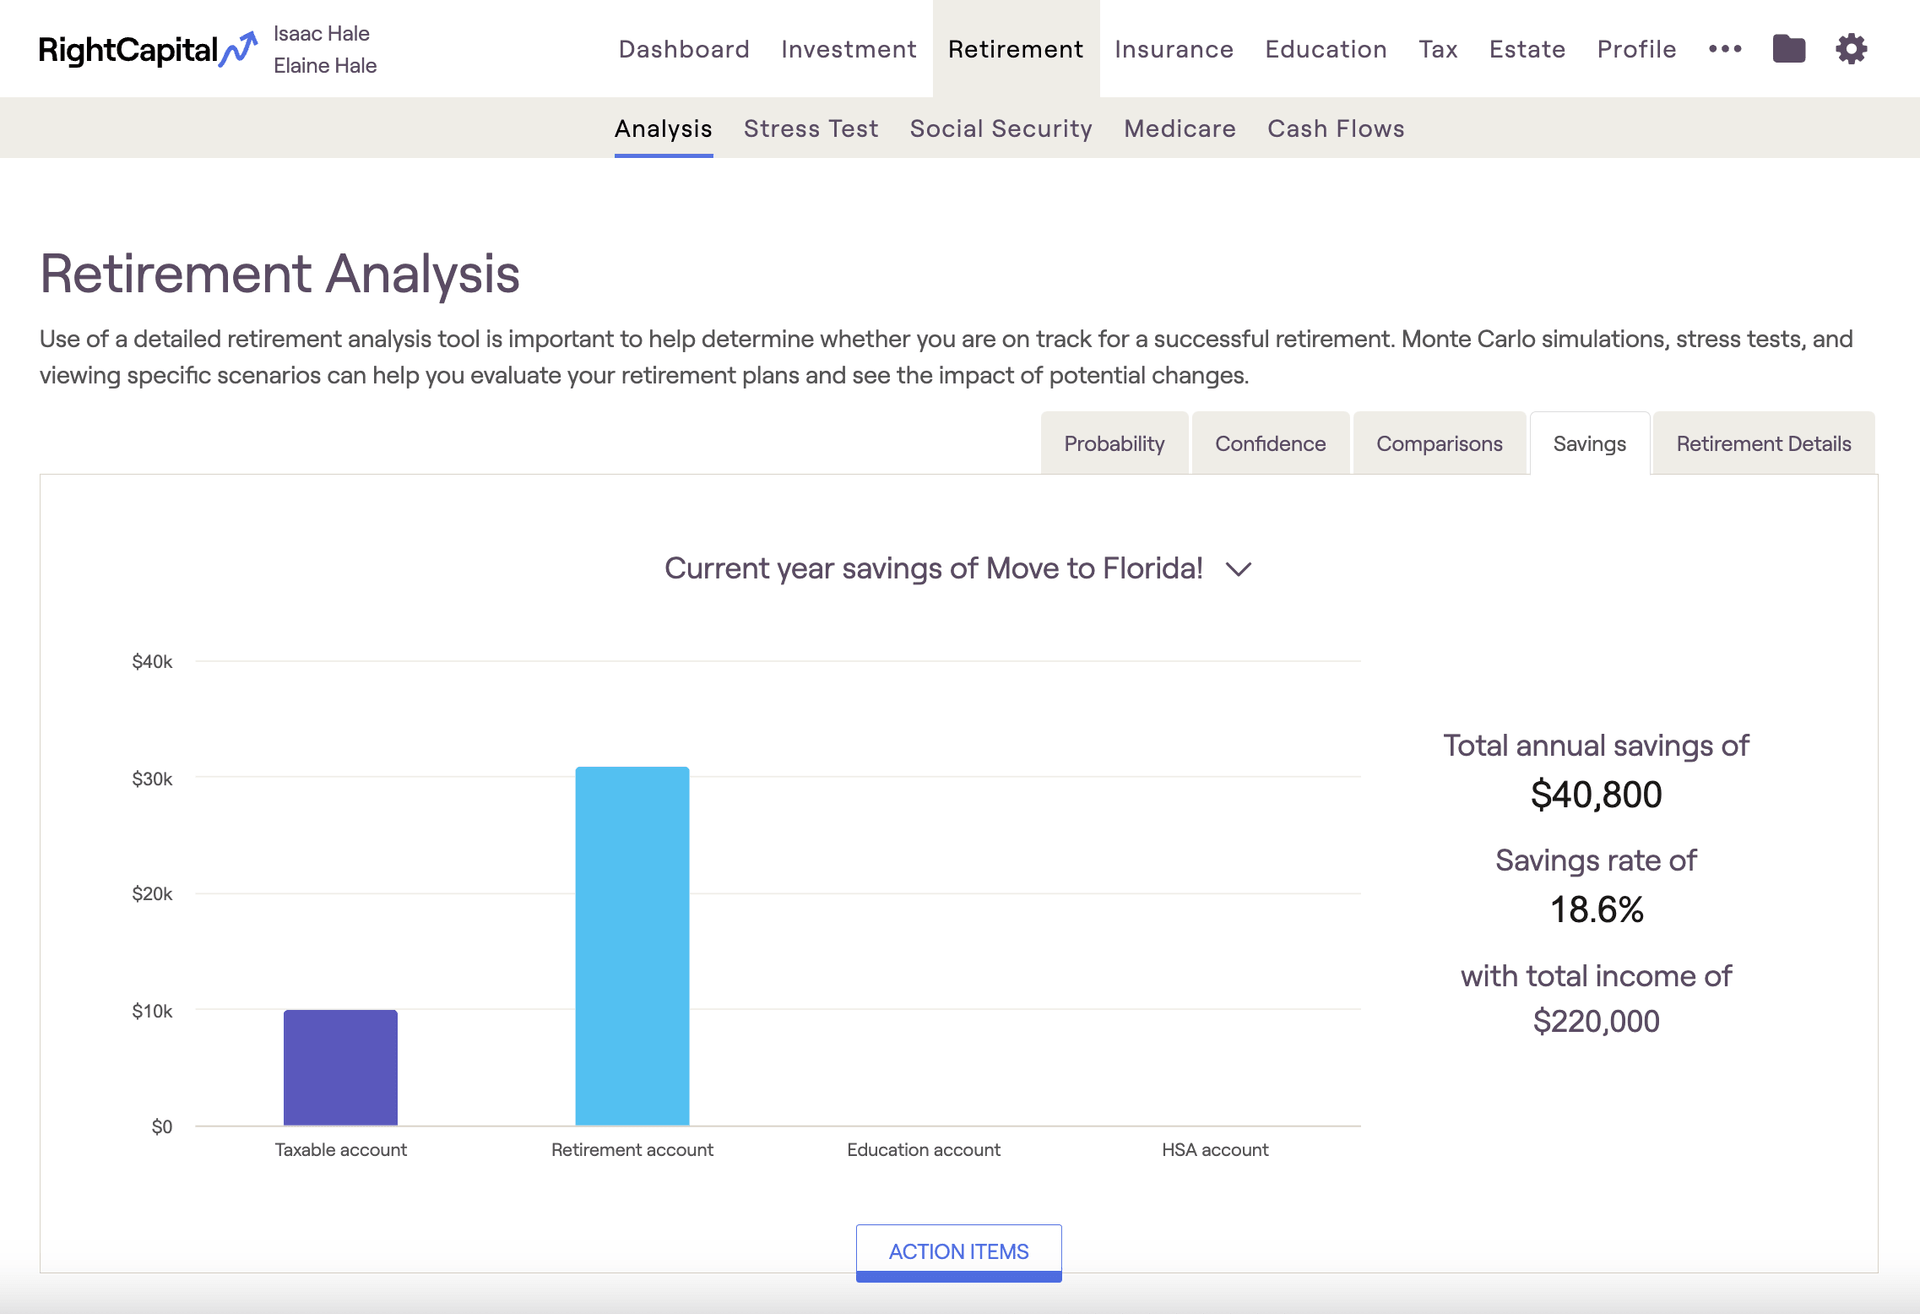
This chart highlights investment contributions occurring in year one of the cash flow projections:
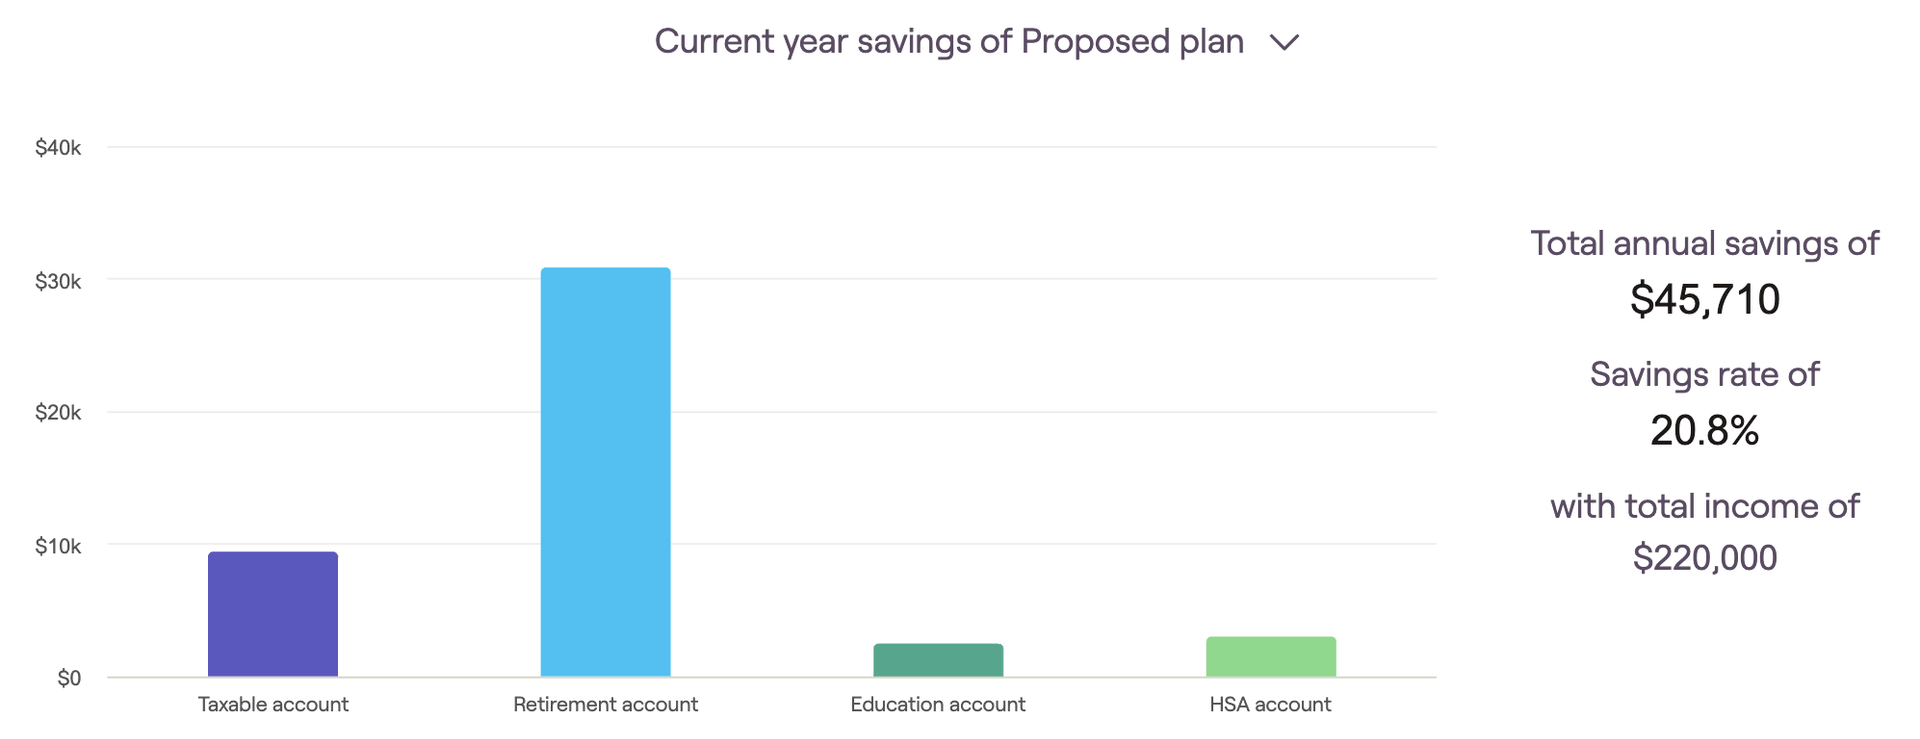
The first year of each client plan can be customized using the "Cash Flow in simulation starts" methodology setting. The current year's savings are grouped into four buckets, which are color-coded for visual clarity:
Taxable account savings
Retirement account savings (including 401(k)s, IRAs, Roth IRAs, etc.)
Education account (529) savings
HSA account savings
This tab will also display the total annual savings and the percentage of total income saved to the right of the graph.
Savings over time
This chart illustrates the annual investment contributions that occur until the first client retires:
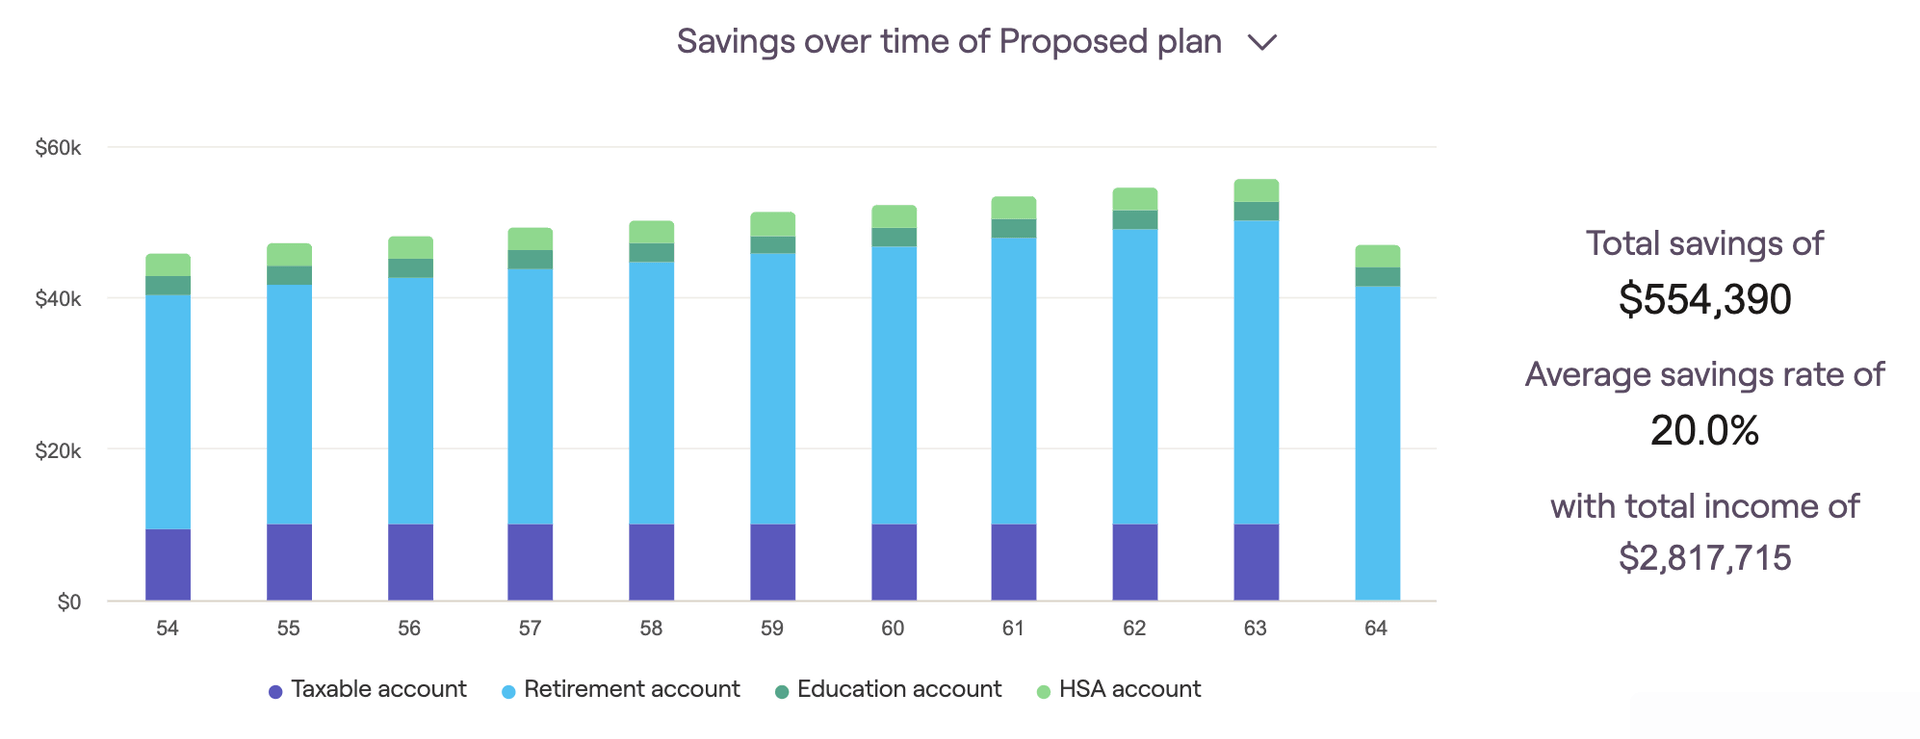
Savings are grouped into the same four buckets described above, and are color-coded identically. The "total savings" and "average savings rate" will be listed on the right side of the graph.
As a reminder, you can use the "today's dollars" toggle in the lower right to discount the values displayed by your general inflation rate.
Savings rate
This chart recalculates annual savings as a percentage of the client's income:
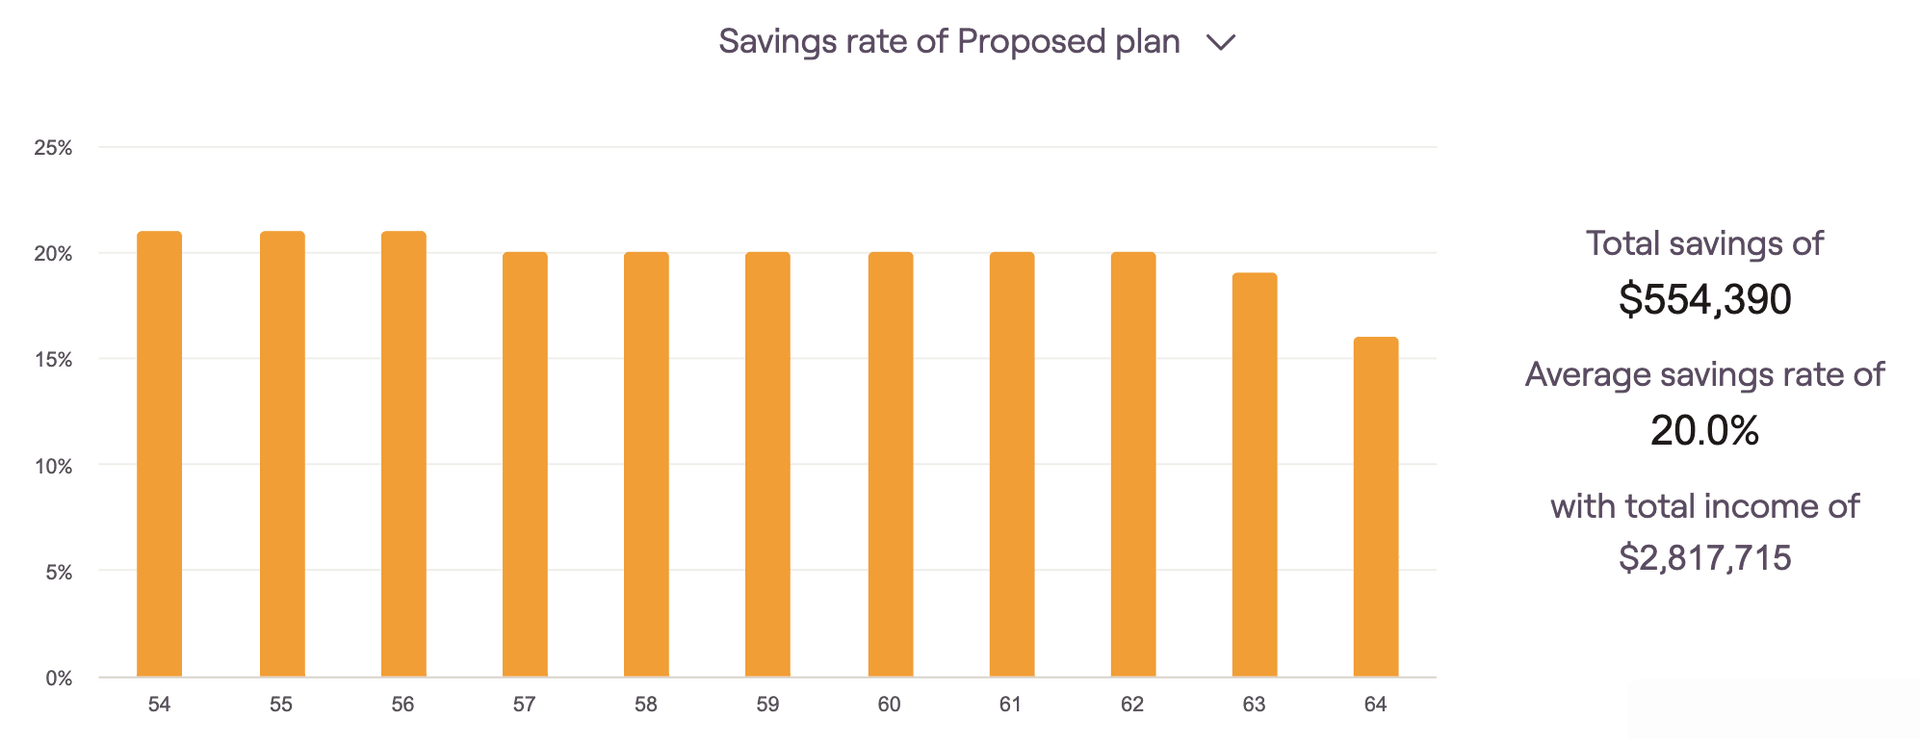
The savings rate percentage for each year is equivalent to total savings divided by total income. You can hover your mouse over the bar chart to isolate the exact savings % for a particular year. The "average savings rate" will also be listed to the right of the graph.
Total savings and returns
This graph highlights the individual impact of investment contributions and portfolio return as a client's assets accumulate. It displays the current portfolio value, cumulative portfolio return, and total employer/employee savings each year until the first client retires:
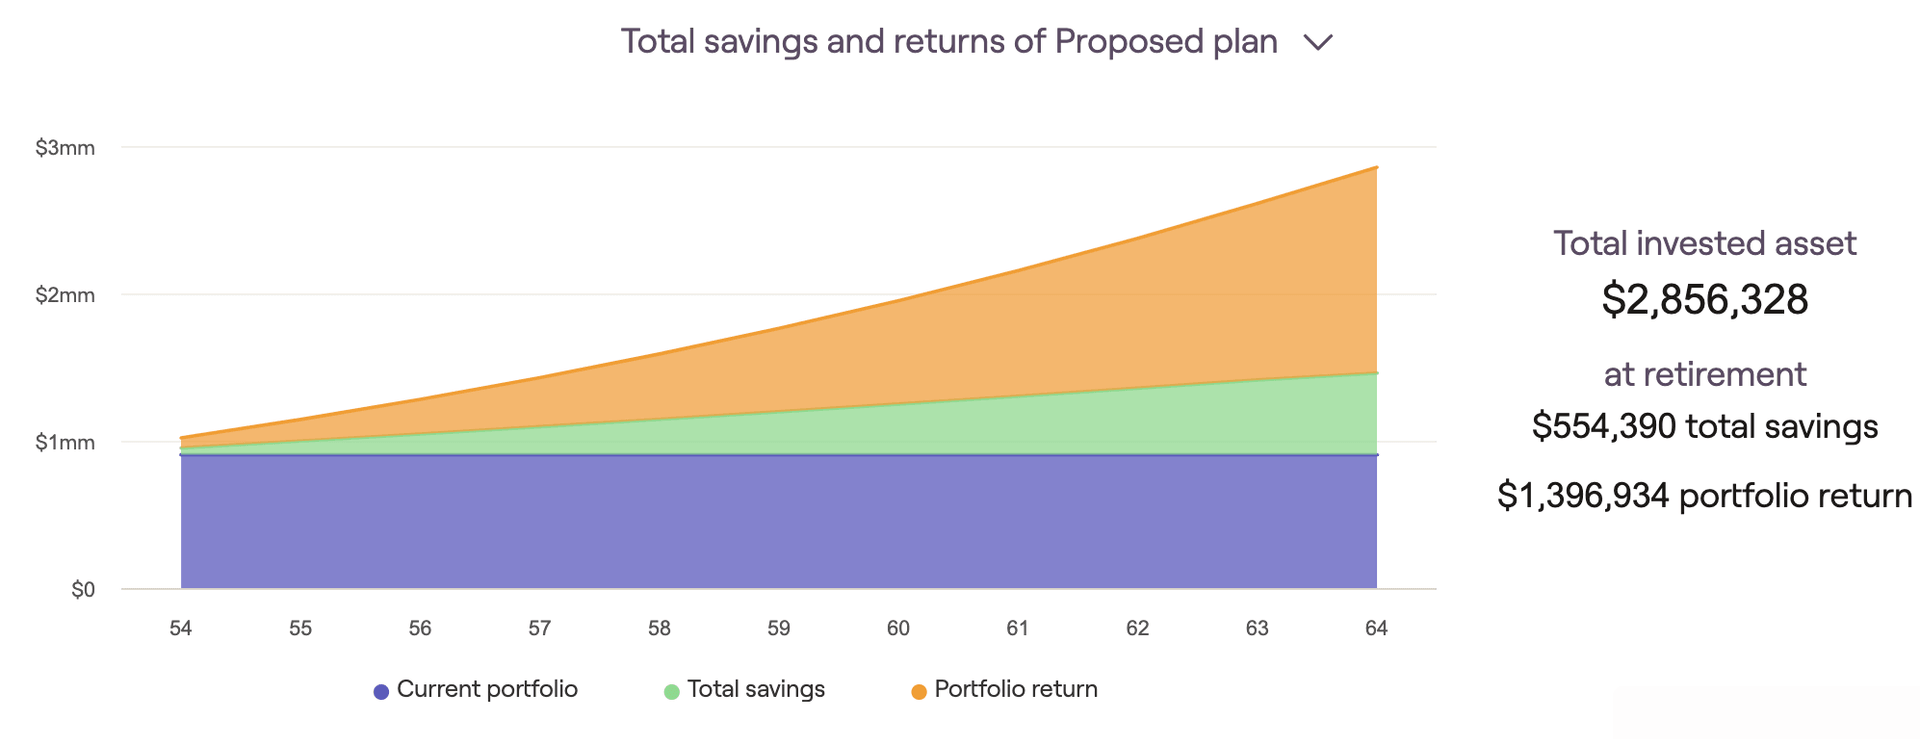
Any pre-retirement withdrawals from invested assets will be shown as a reduction in the current portfolio value (potentially dipping beneath the "x-axis"). The total invested assets when the first client retires are listed to the right of the graph. This graph is using the Baseline scenario to project growth on investments.


