The Comparison tab is the best place to directly compare your proposed and reference tax strategies. There are six charts available here, comparing and contrasting various elements of each strategy to help clients better understand the value of your recommendations.
Invested assets
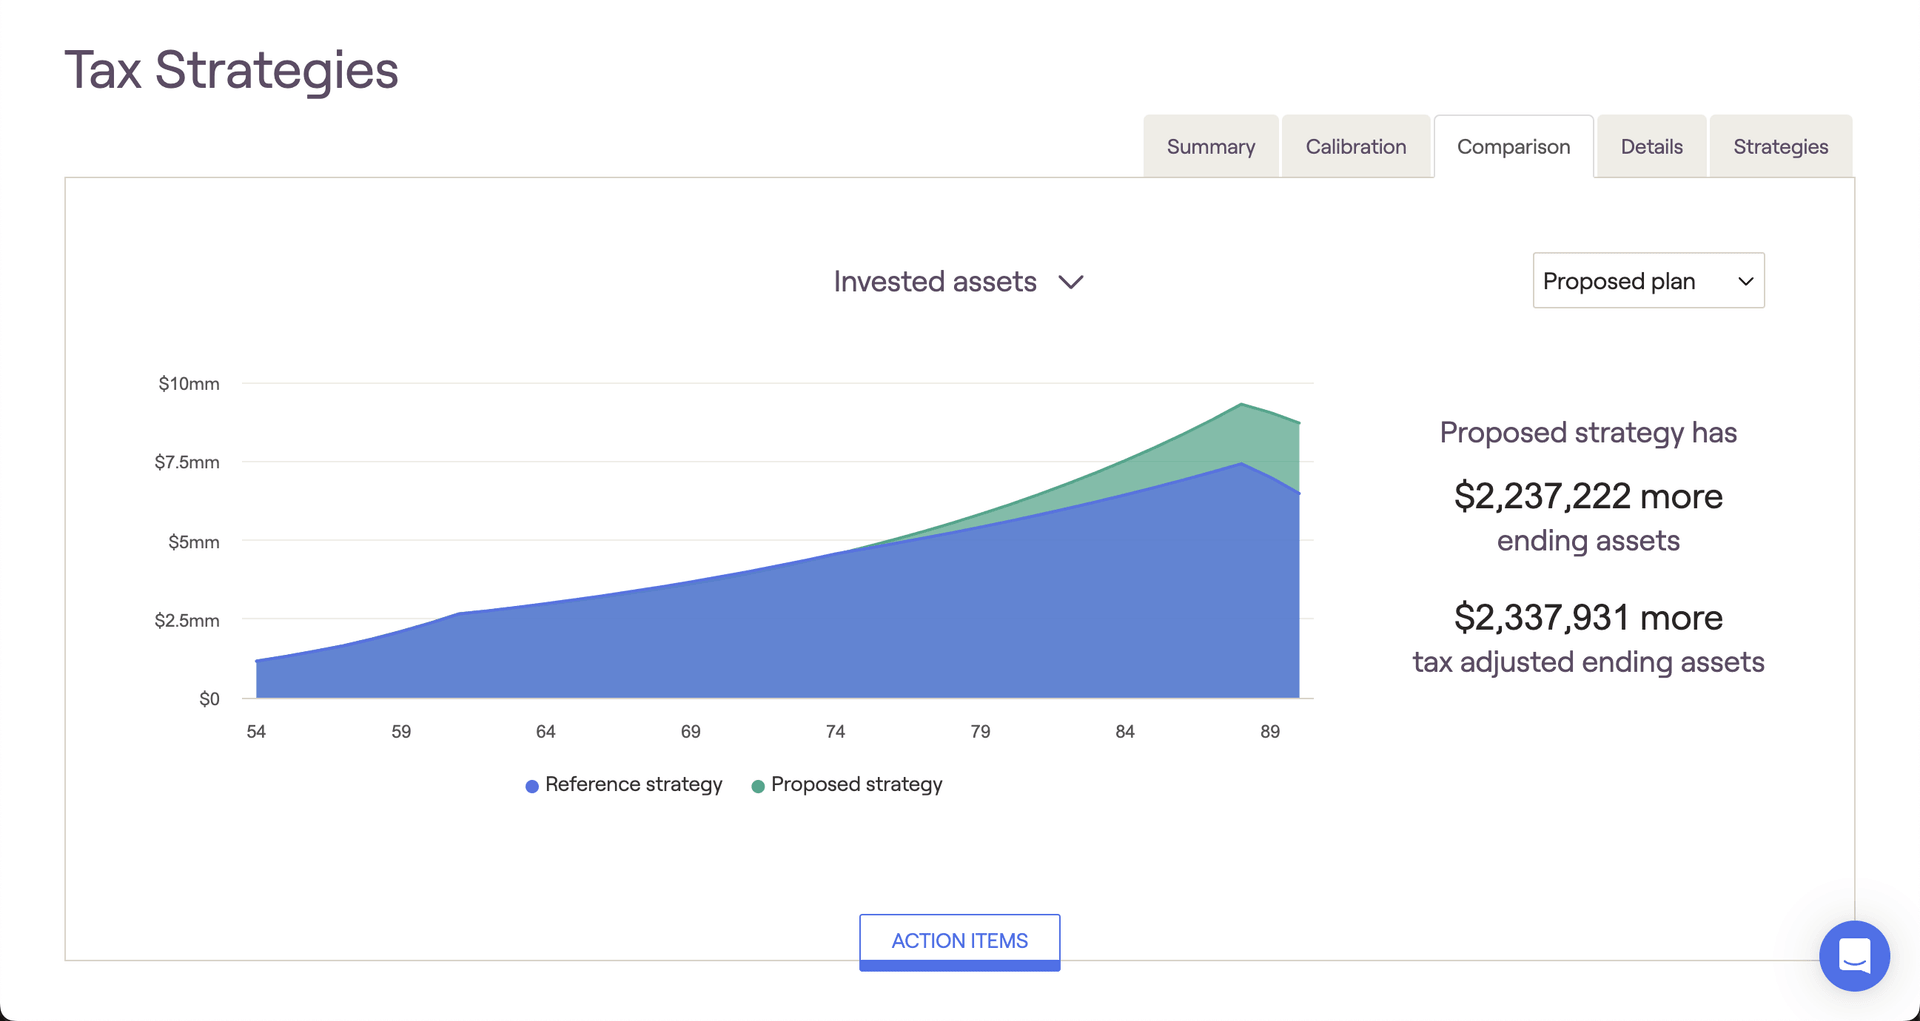
The Invested assets chart is borrowed from the Retirement Analysis module, comparing the value of invested assets over time (excluding real estate and other assets). To the right of the chart you will find two key metrics highlighting the difference between your proposed strategy and reference strategy. The "tax-adjusted" figure will factor in your estimated terminal tax rate, whereas the "ending assets" value will not. If your estimated terminal tax rate is set to 0%, these values will be the same:
Federal tax paid
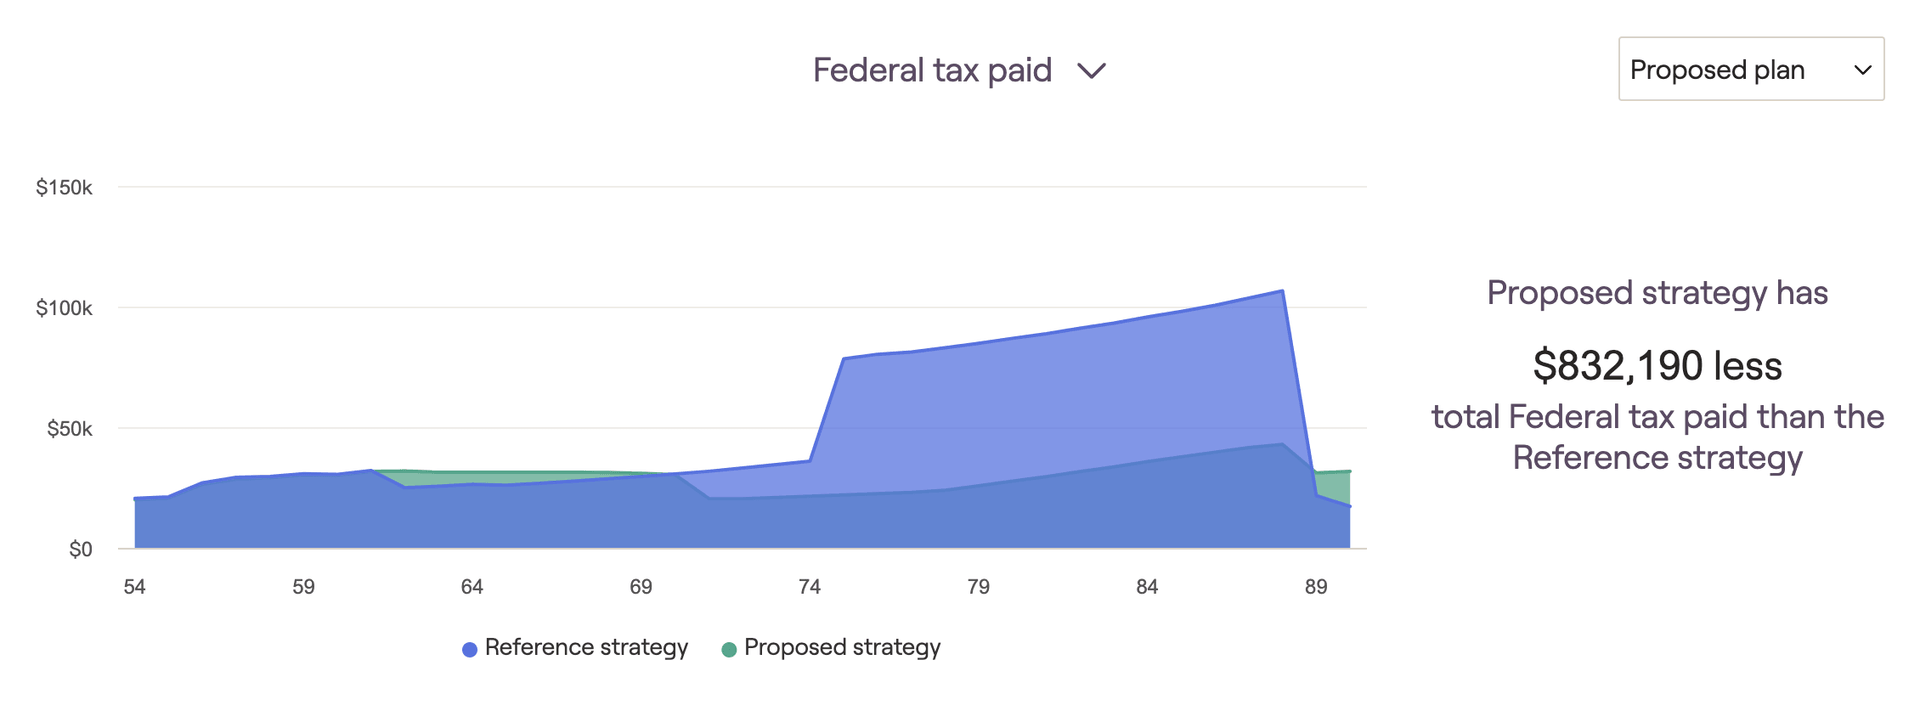
The Federal tax paid chart compares the client's estimated tax burden throughout the projections. Hover your mouse over the chart to track annual federal tax payments each year. The key metric to the right of the chart will display the client's tax savings as a result of your proposed tax strategy:
Required minimum distributions
The Required minimum distributions chart highlights the difference in RMDs between your proposed and reference strategies. Hover your mouse over the chart to track annual RMDs for each strategy. The key metric to the right of the chart will display the cumulative difference between the proposed and reference strategies:
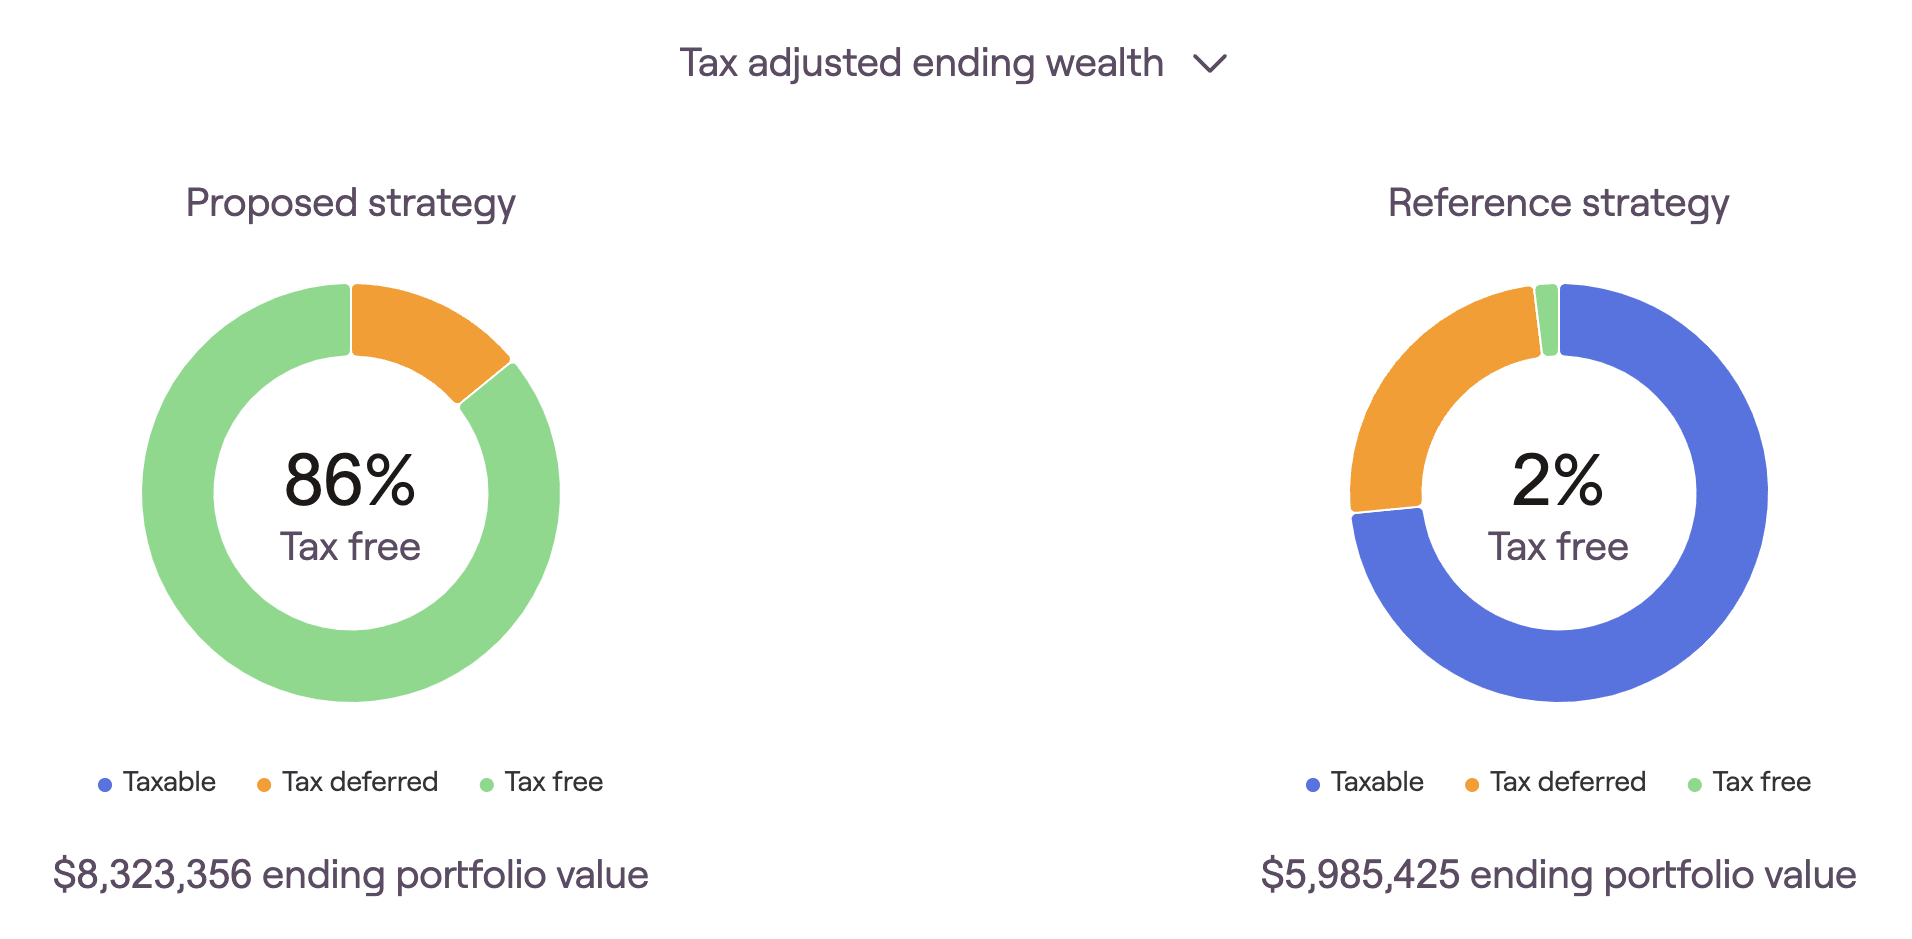
Tax adjusted ending wealth
The Tax-adjusted ending wealth screen provides two pie charts, detailing the end-of-plan investment portfolios for the proposed and reference strategies respectively. Here you will find a breakdown of each strategy in terms of overall ending portfolio value, in addition to how that portfolio is divided between the three tax buckets.
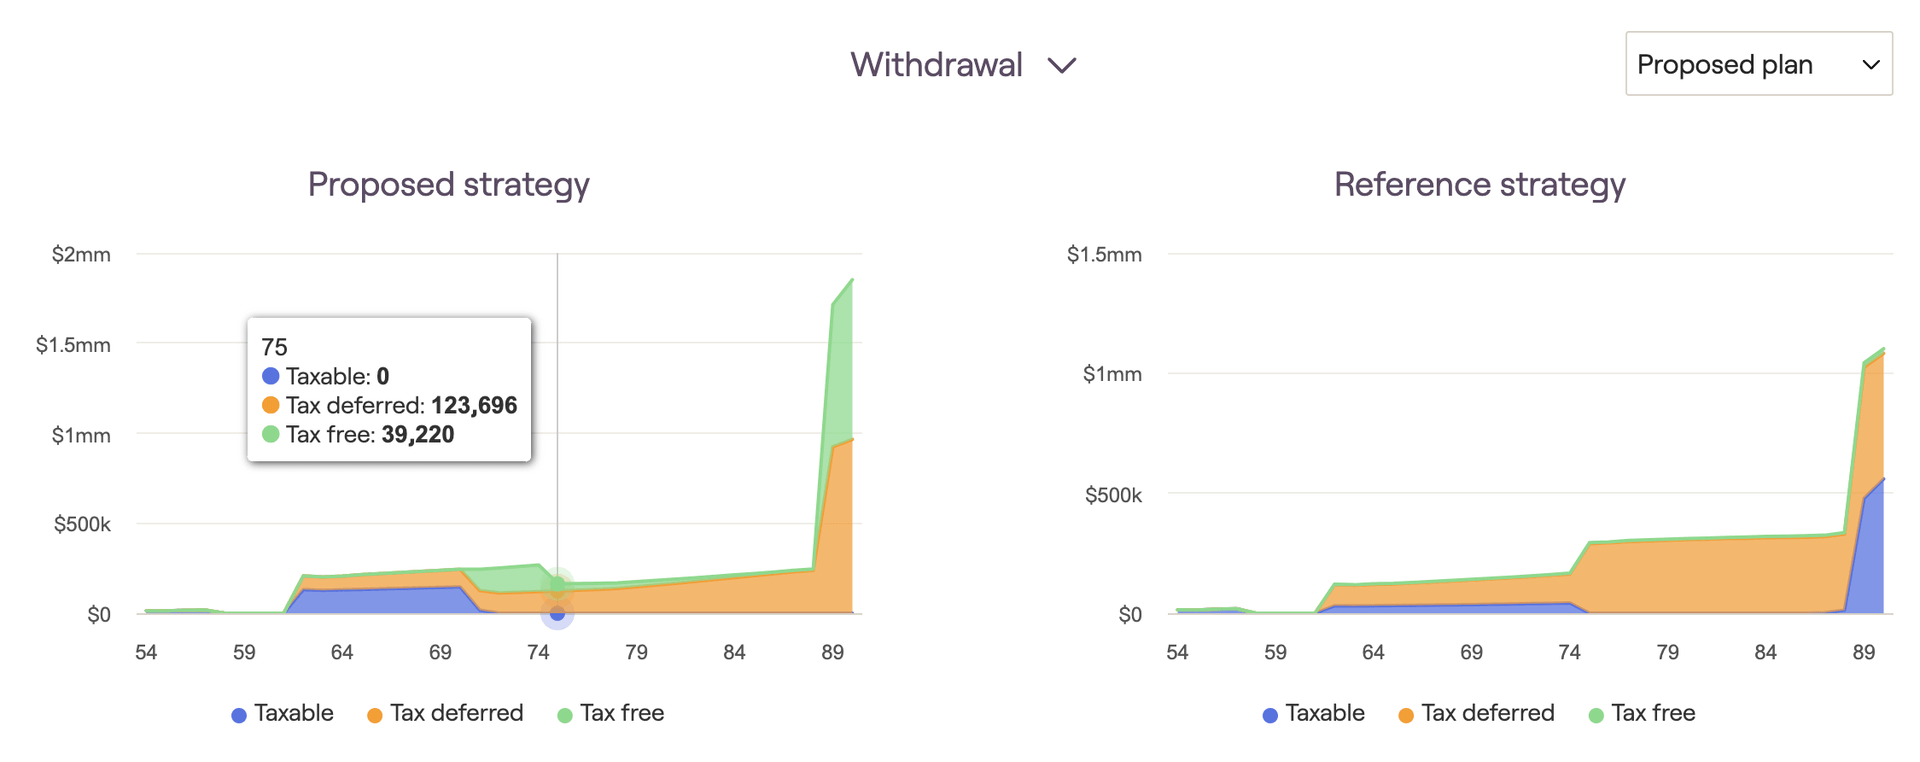
Withdrawal
The Withdrawal screen compares taxable, tax-deferred, and tax-free withdrawals between your proposed and reference strategies. Hover your mouse over each chart to track specific dollar values for each year:
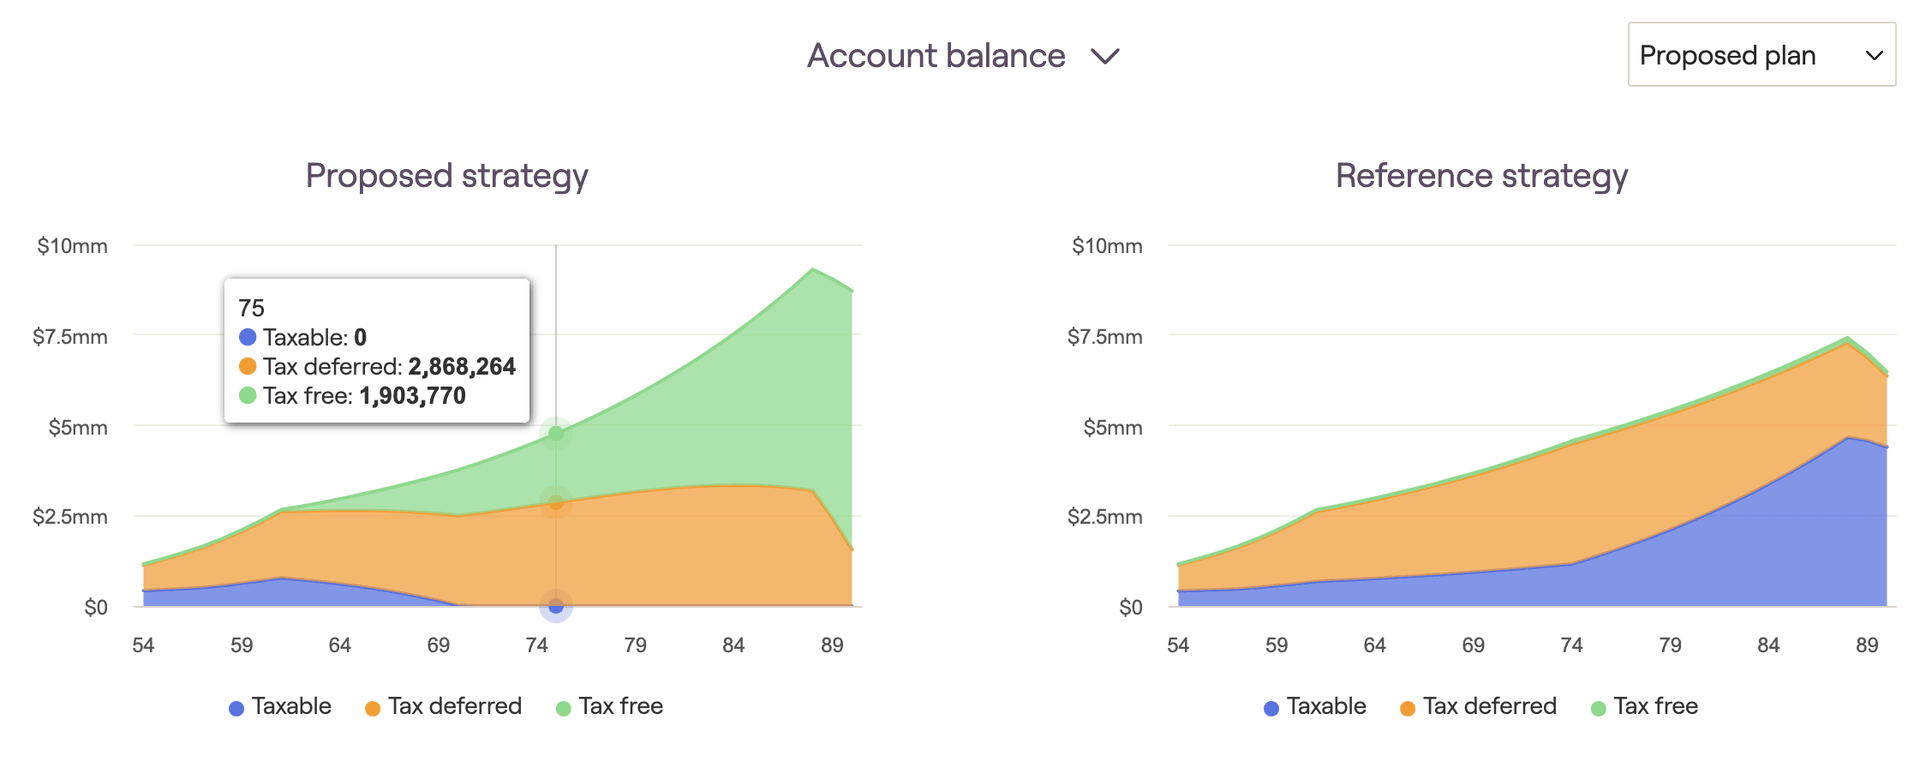
Account Balance
The Account balance screen compares taxable, tax-deferred, and tax-free account balances between your proposed and reference strategies. Hover your mouse over each chart to track specific dollar values for each year: