The Calibration tab is one of five sub-tabs available within the Tax Strategies module. This can be found within the Tax > Tax Strategies tab of each client plan:
The Calibration screen provides insight into where clients fall in relation to various tax bracket thresholds. Federal income tax brackets, capital gains brackets, and IRMAA brackets for Medicare premium adjustments can all be viewed via the dropdown menu above the graph. You will also find the key tax components that make up the client's taxable income during each year of the financial plan:
We recommend using the Calibration tab when dialing in a Roth conversion strategy. Choose the chart that corresponds with your conversion target to clearly see conversions occurring up to your specified bracket threshold.
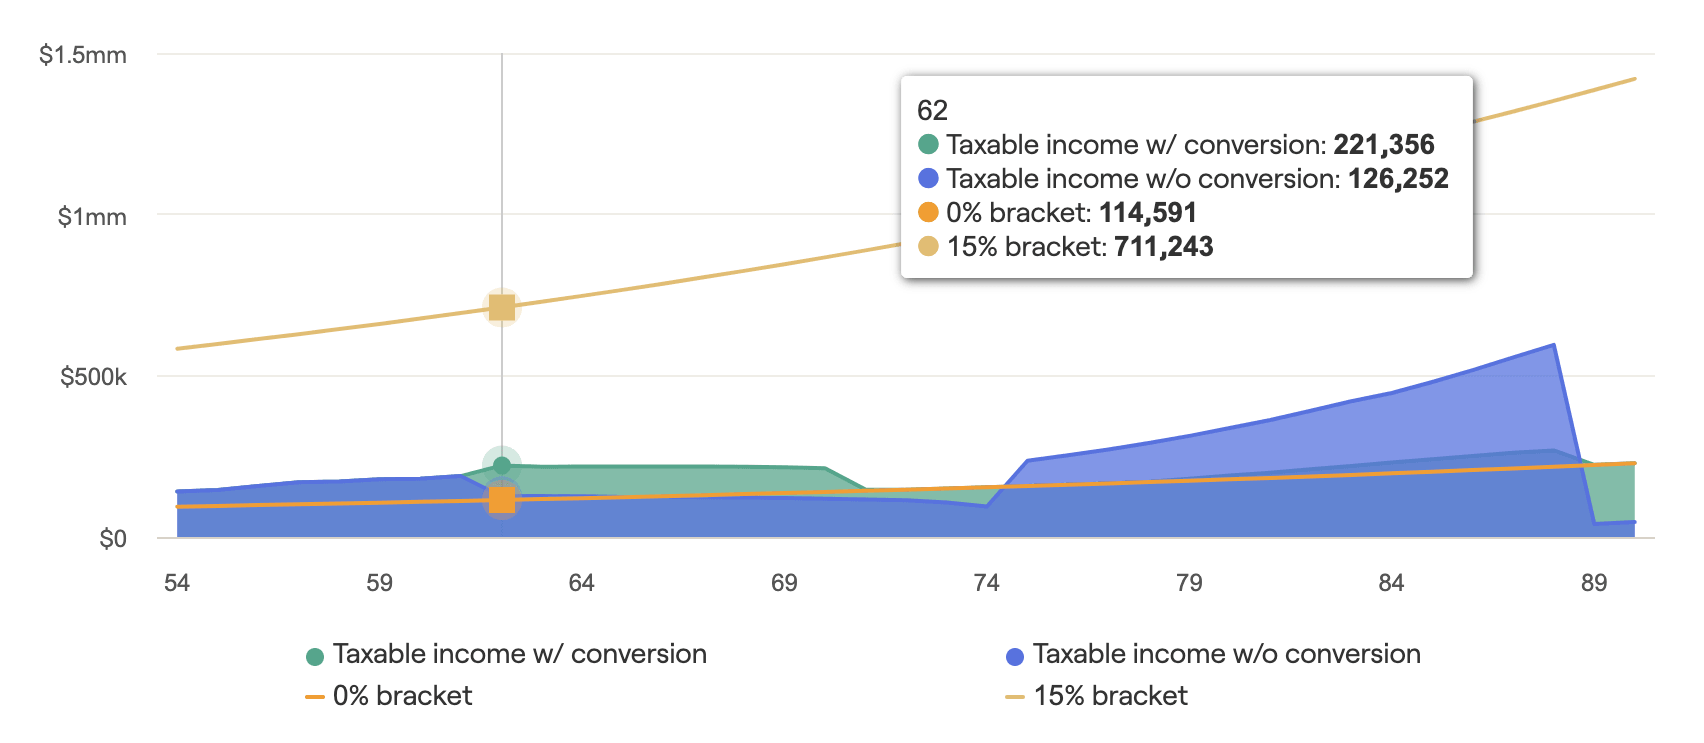
The initial chart illustrates the client's adjusted taxable income in relation to ordinary income tax brackets. If you are modeling a Roth conversion strategy, you will see the adjusted taxable income with conversions in green, and without conversions in blue. Hover your mouse over the chart to view specific dollar values:
What is "adjusted" taxable income?
Adjusted taxable income is the portion of a client's taxable income that is subject to ordinary income tax. It excludes qualified dividends and long-term capital gains.
Tax bracket thresholds will increase each year based on your Tax Inflation rate. You can use the legend beneath the chart to highlight, add, or remove items for visual clarity.
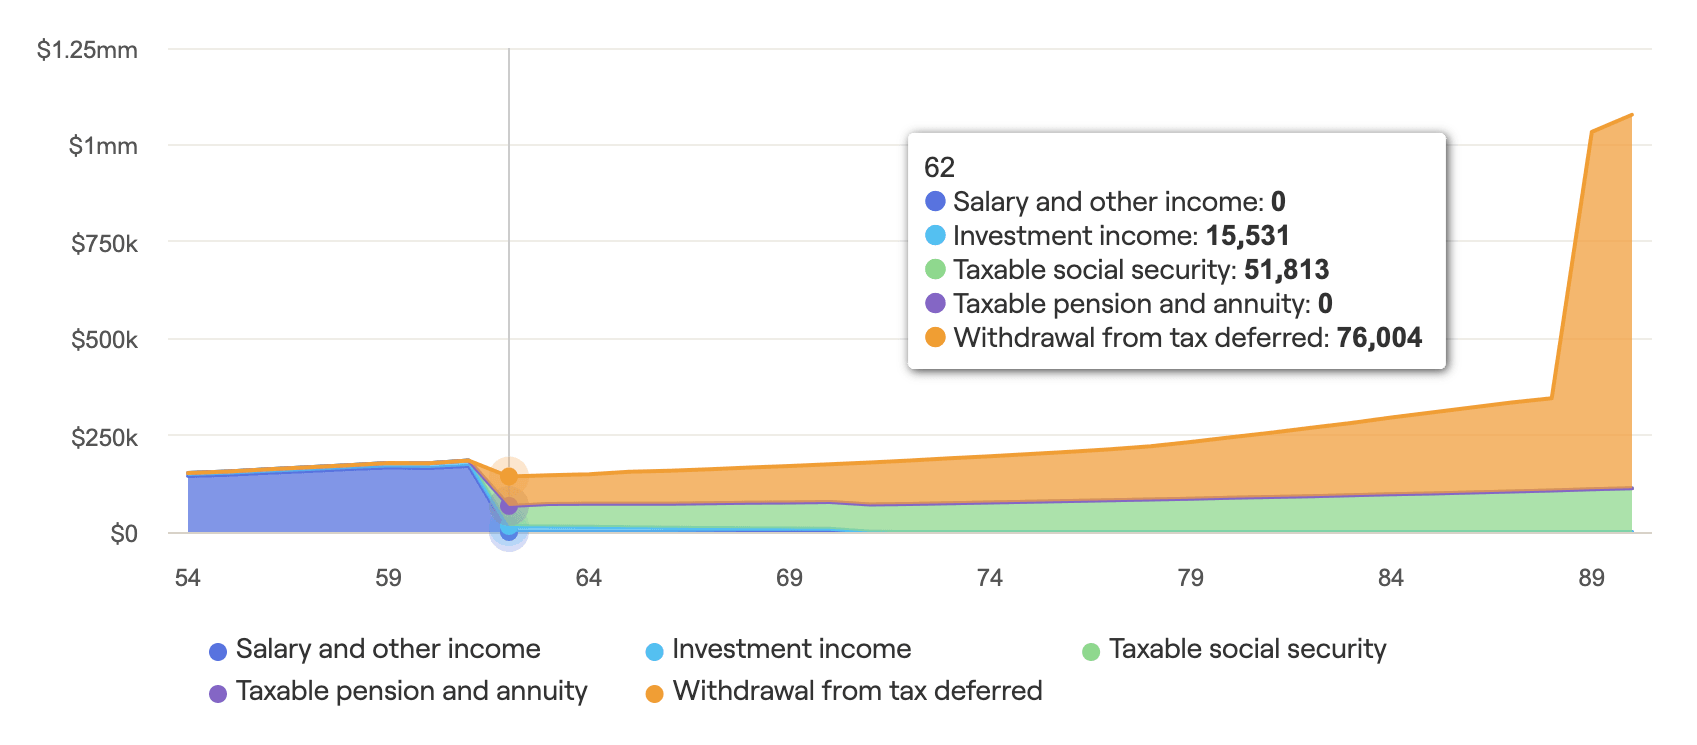
The Key tax components chart will separate out several of the key elements that make up a client's overall taxable income over the course of their projections. This includes Salary and other income, investment income (interest and dividends), taxable social security, taxable pensions and annuities, and tax-deferred withdrawals. Please note that this chart will factor in any changes you've made within the Action Items for one or more tax strategies:
The Capital gains tax bracket graph shows the household’s total taxable income in relation to the capital gains bracket thresholds (0% and 15%). Capital gains income above the 15% bracket will be taxed at 20%.
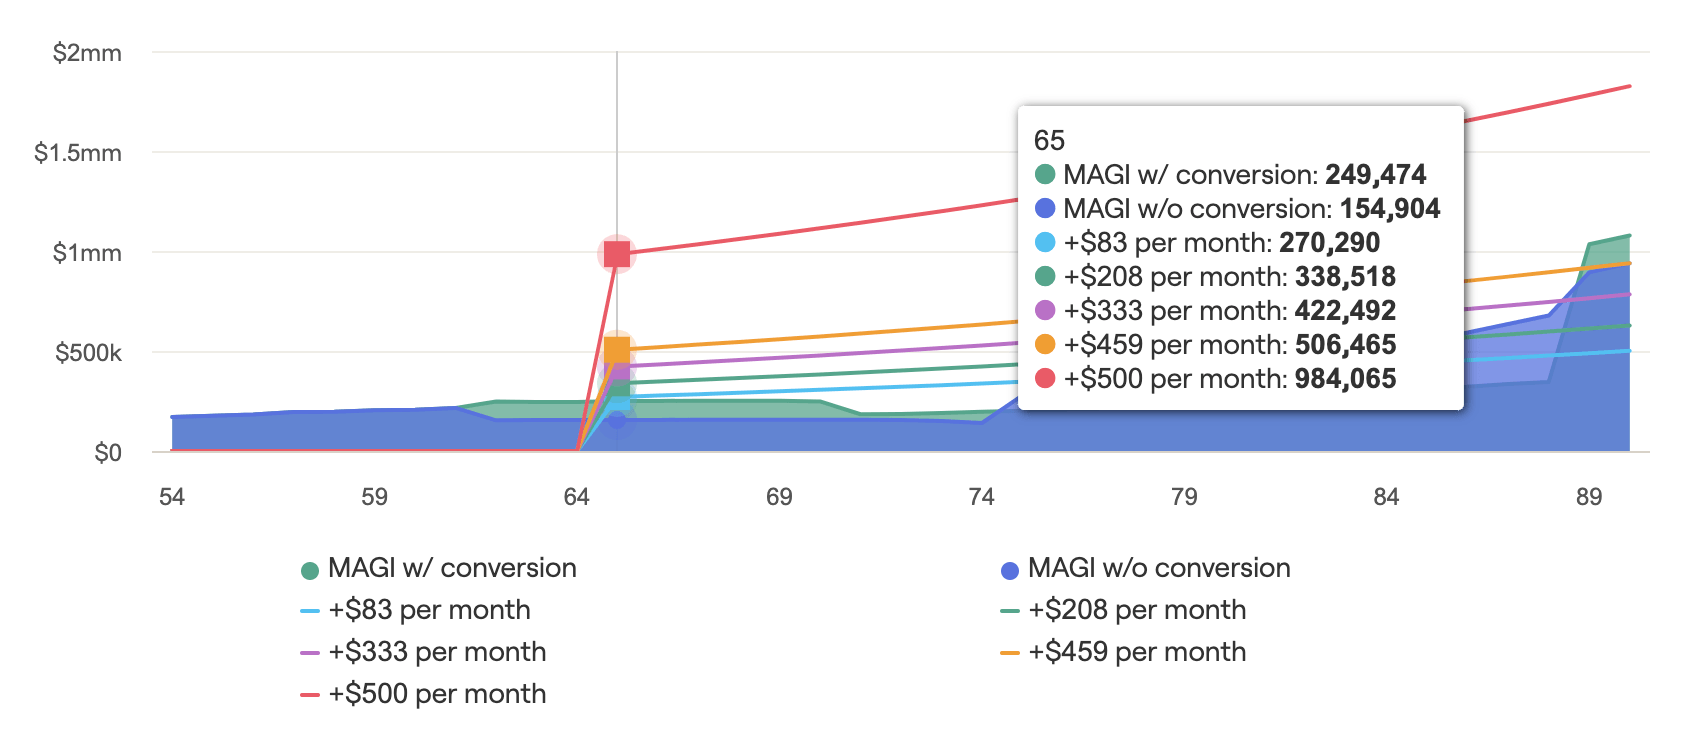
The Medicare premium tax bracket graph shows the household’s Modified Adjusted Gross Income (MAGI) in relation to the IRMAA thresholds that trigger higher Medicare premiums. The lines on the graph denote the monthly increase in the premium amount based on each MAGI threshold:
Contact Us
For additional assistance within RightCapital please contact our Support team.
Educational Webinars
RightCapital is committed to enabling your success. Each week, we cover essential planning modules and product updates.
RightCapital in Action
Check out our YouTube channel where we highlight Advisor Success Stories and share more Tips & Tricks!