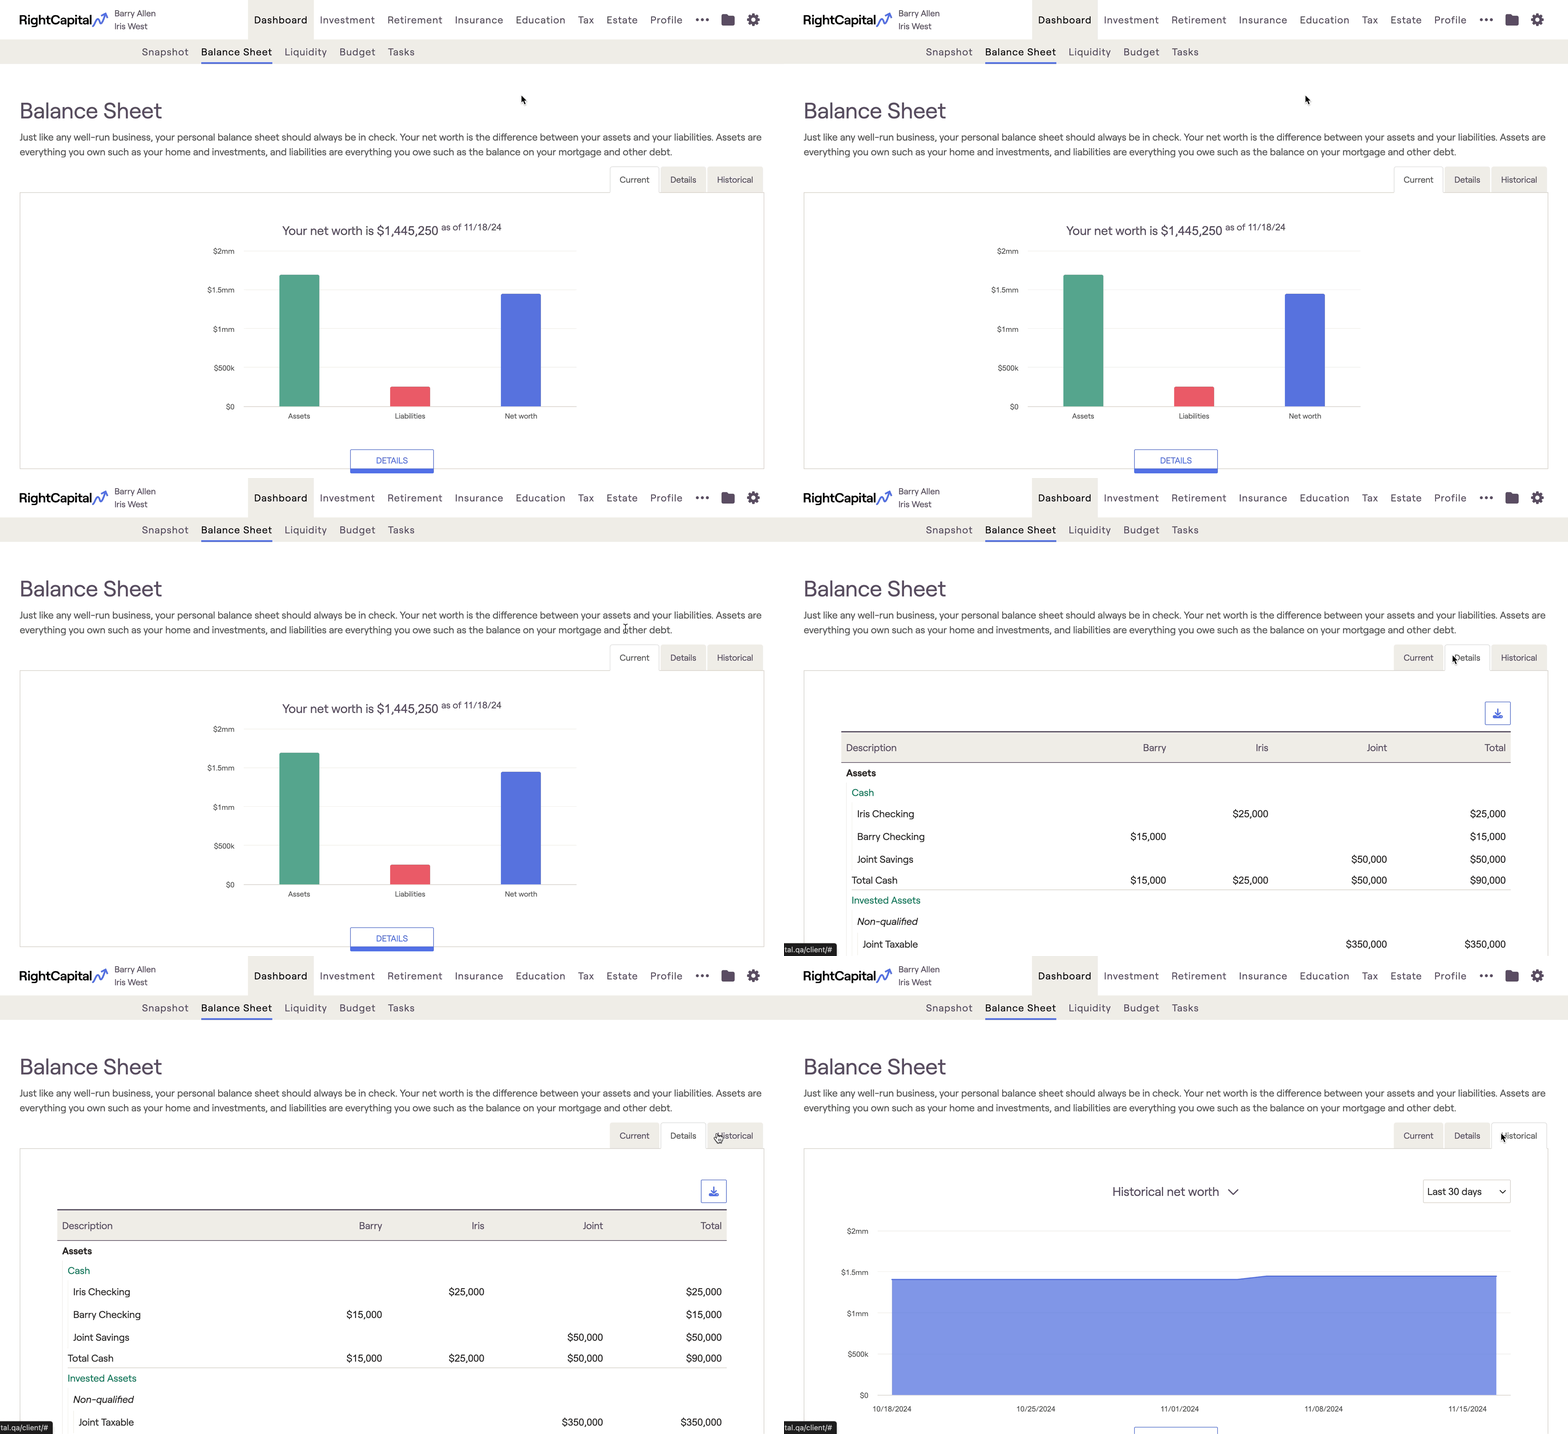
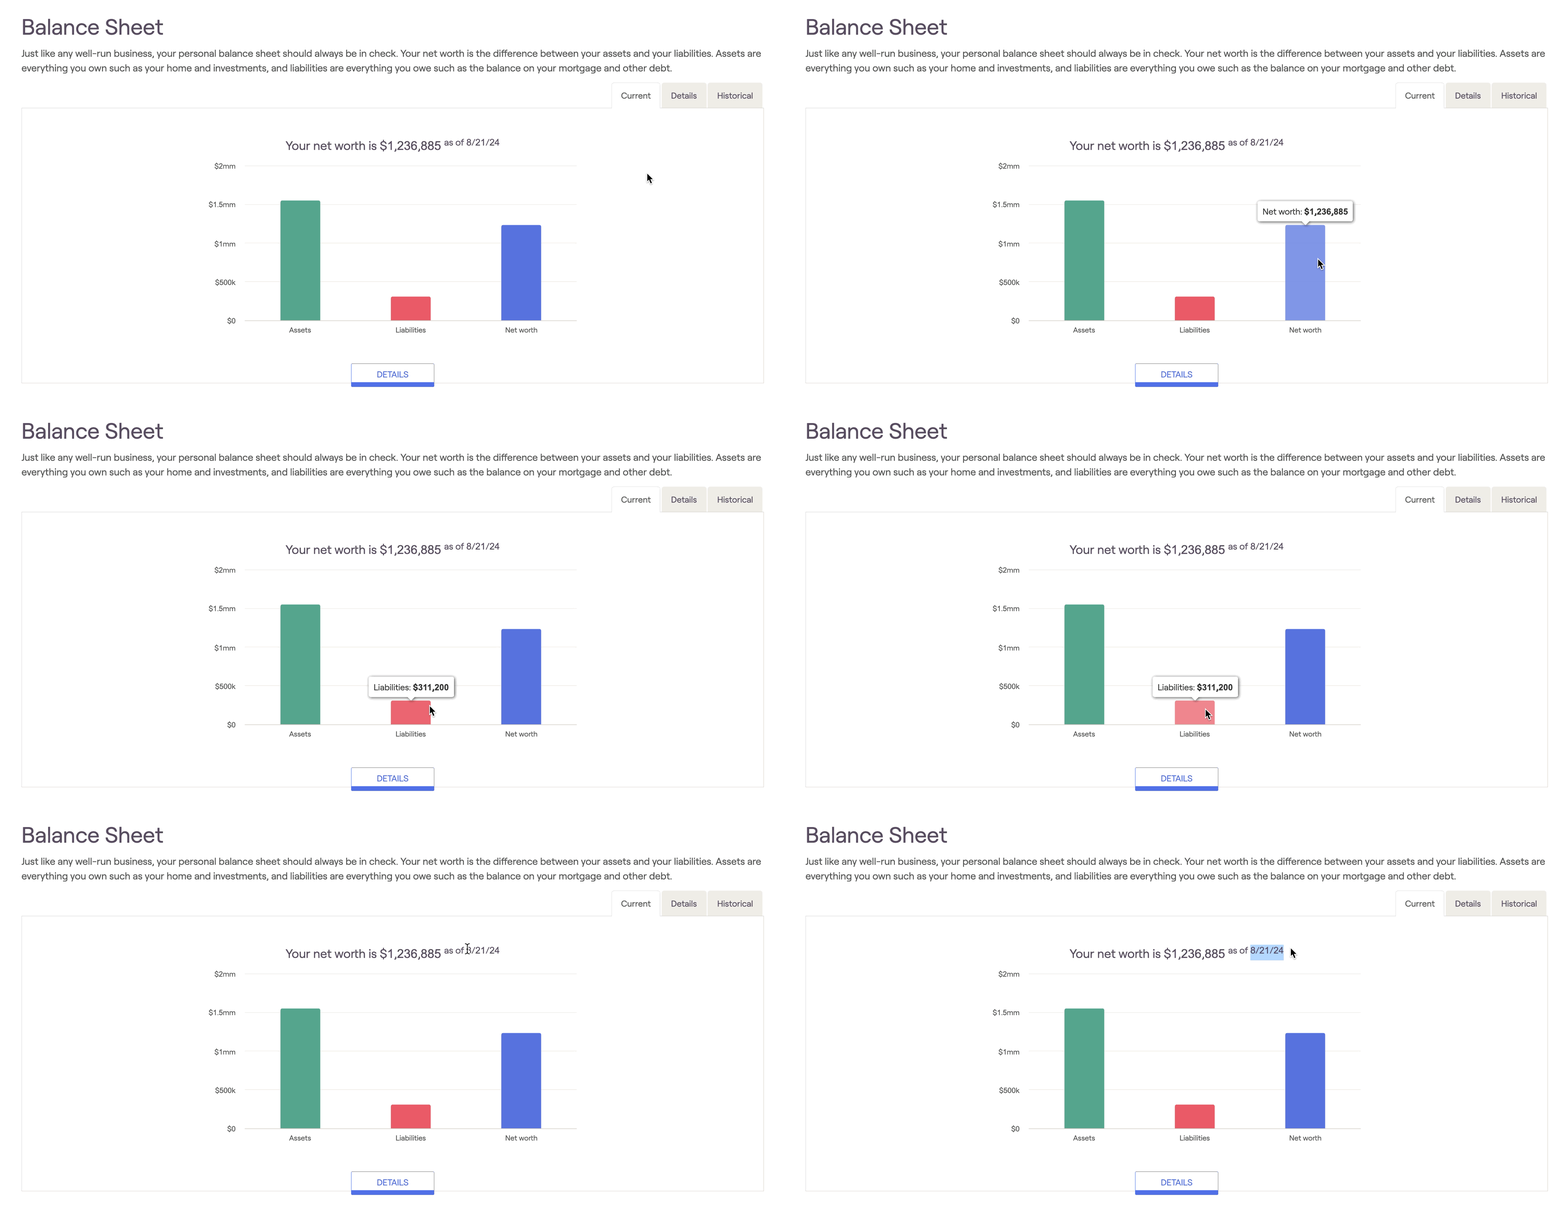
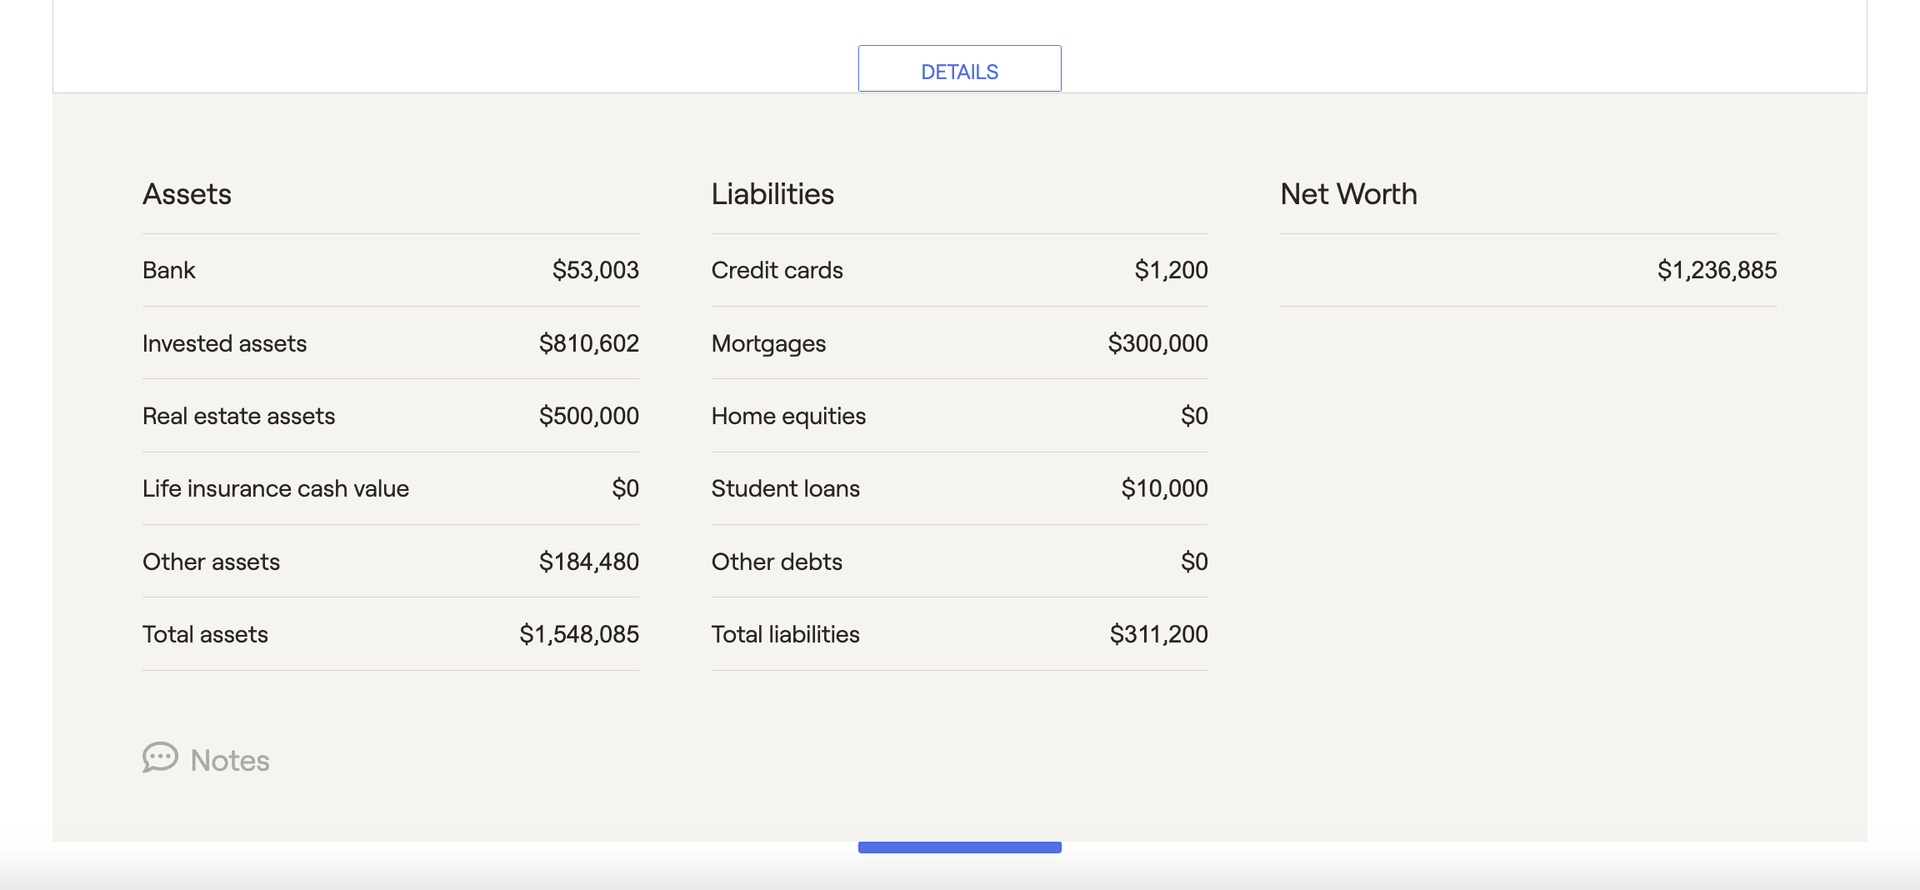
Current Tab
Details
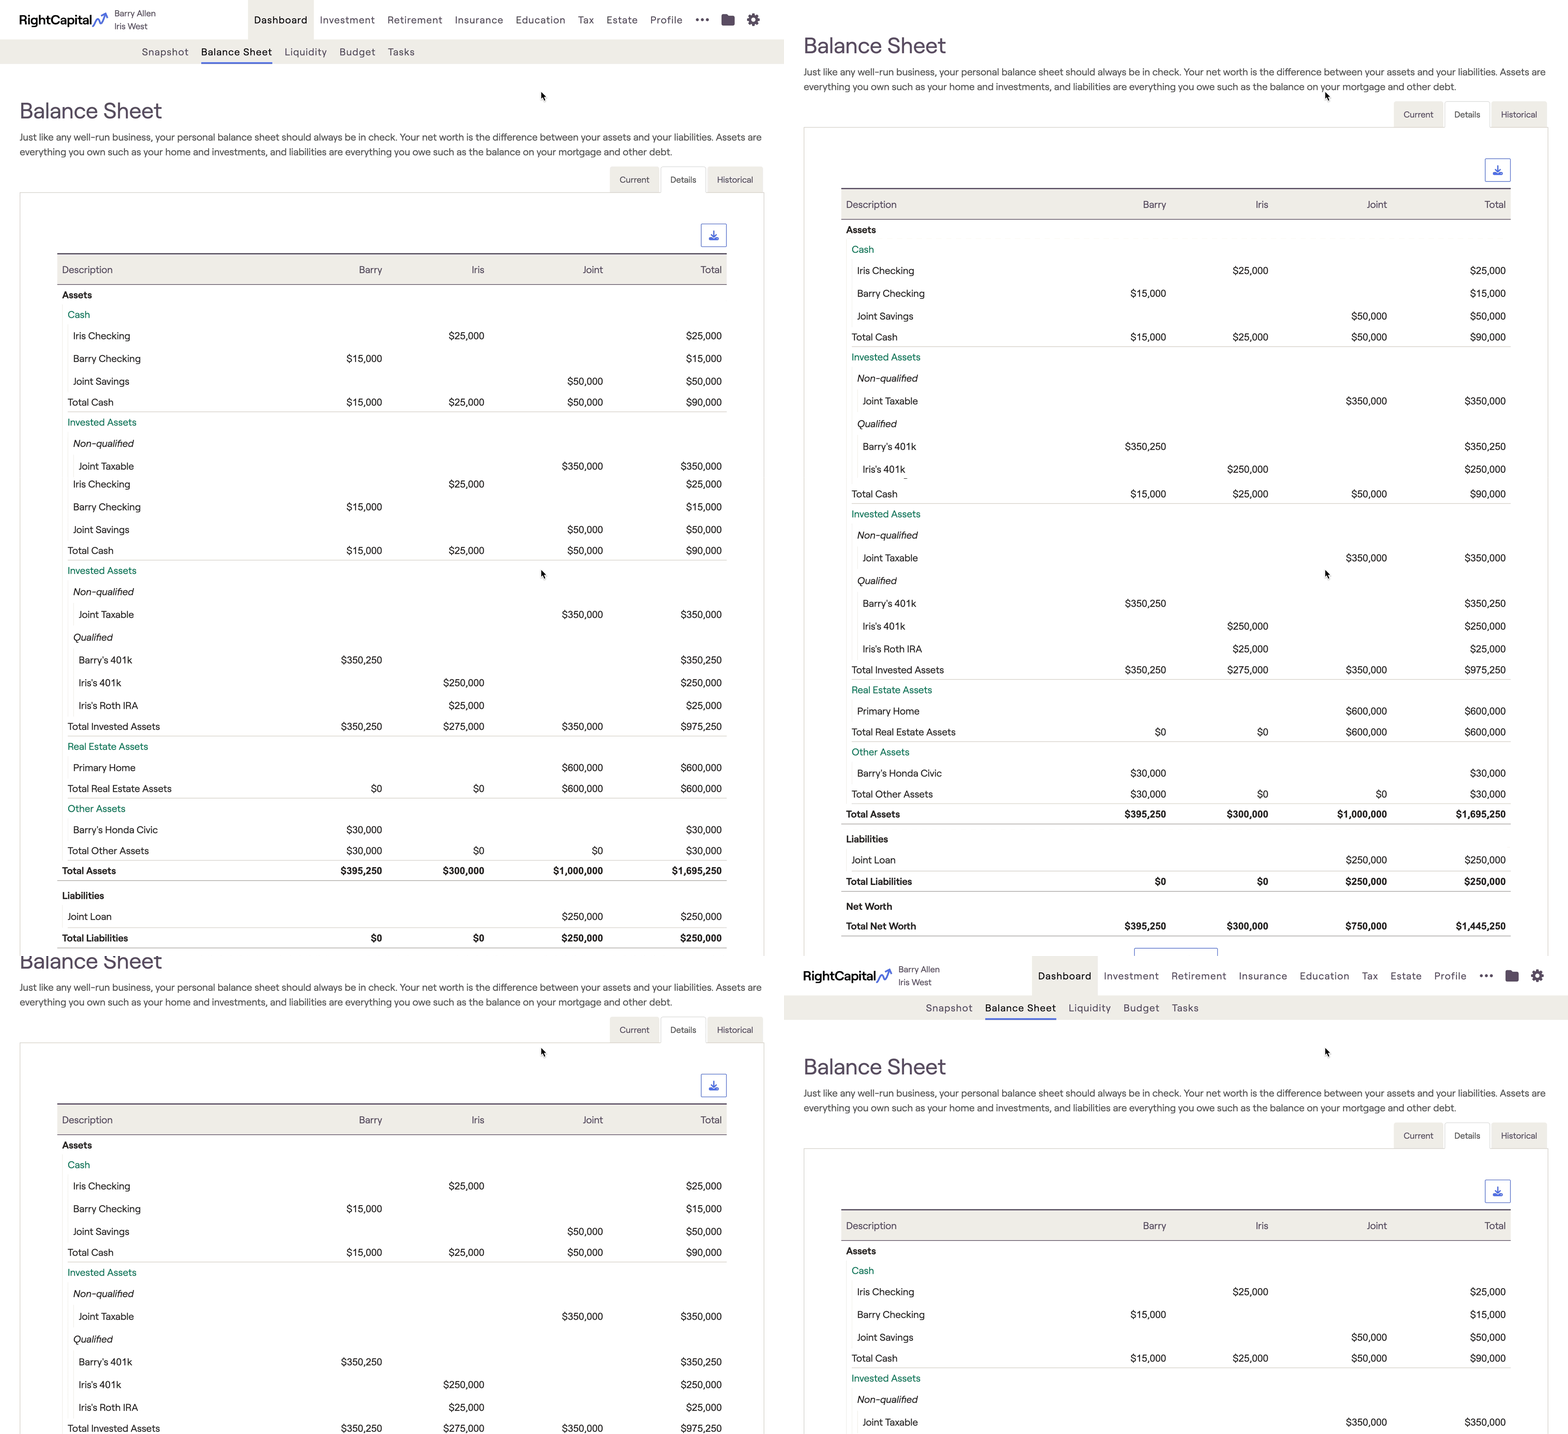
Category | Description |
|---|---|
Cash | Reflects all Bank accounts entered within the Net Worth section of the Profile. |
Invested Assets | Reflects all Investment accounts entered within the Net Worth section of the Profile. |
Real Estate Assets | Reflects all properties entered within the Net Worth section of the Profile. |
Business Assets | Reflects all Businesses entered within the Net Worth section of the Profile. |
Other Assets | Reflects all Stock Plans and Other Assets entered within the Net Worth section of the Profile. |
Liabilities | Reflects all Credit Cards and Loans entered within the Net Worth section of the Profile. |
If there are any trust-owned assets within the plan, an additional "Trust" column will populate:

Revocable trusts will be included under "Invested Assets", while Irrevocable trusts will be included under "Other Assets".
Any accounts with a small blue visual indicator are "managed" accounts. Accounts can be marked as "managed" under the Profile > Net Worth > Investments. This is purely for visual/tracking purposes and does not affect the system's calculations. To enable/disable this setting, you can head to the Account Preferences menu under the Advisor Portal.

Clicking the blue Download button in the upper right of this page will export the detailed balance sheet as a CSV file. You can then open this file within Excel, Numbers, or any other spreadsheet software to view the information:
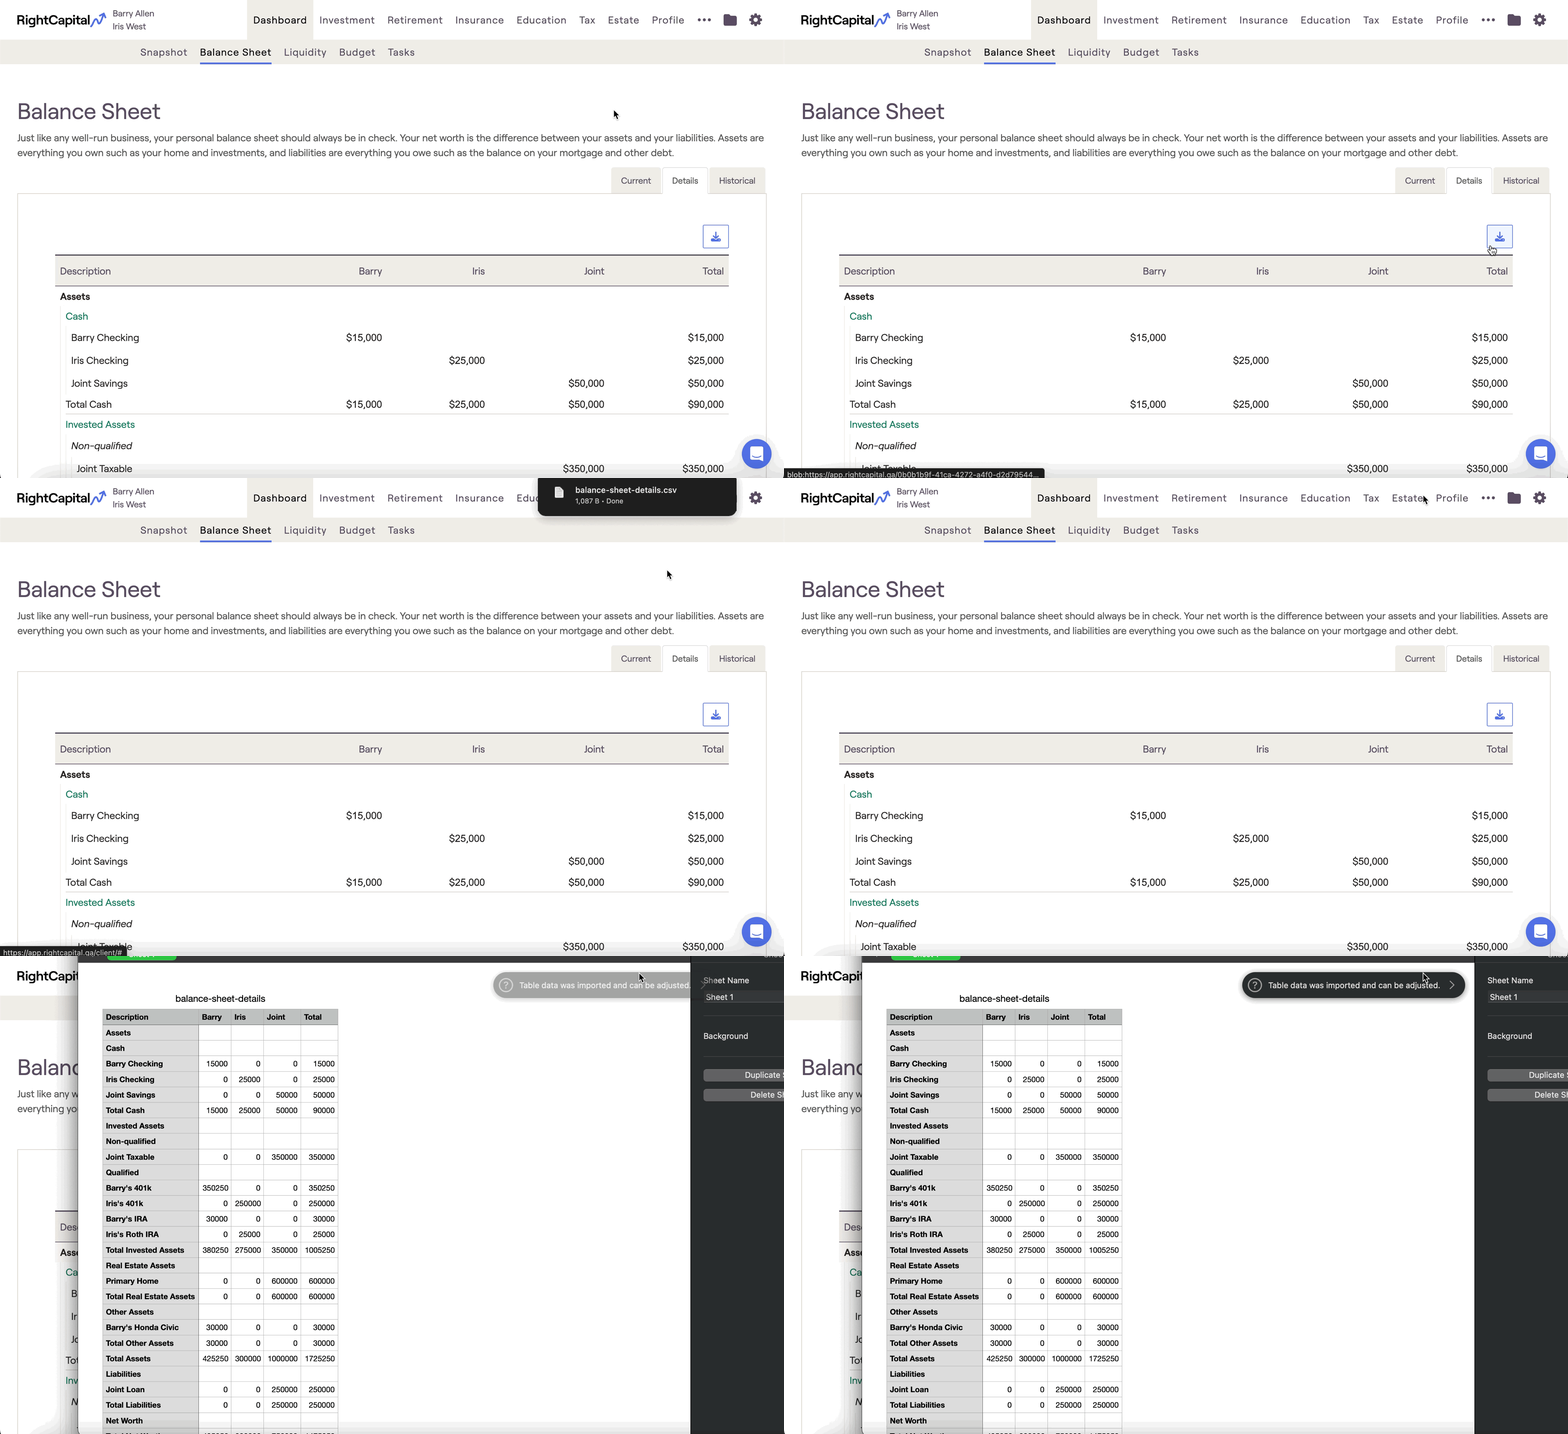
Within each section of the balance sheet, the order that accounts are displayed will mirror the order in the Net Worth section. To rearrange the order, navigate to Profile > Net Worth, choose an asset category, and drag & drop the accounts into your desired order!
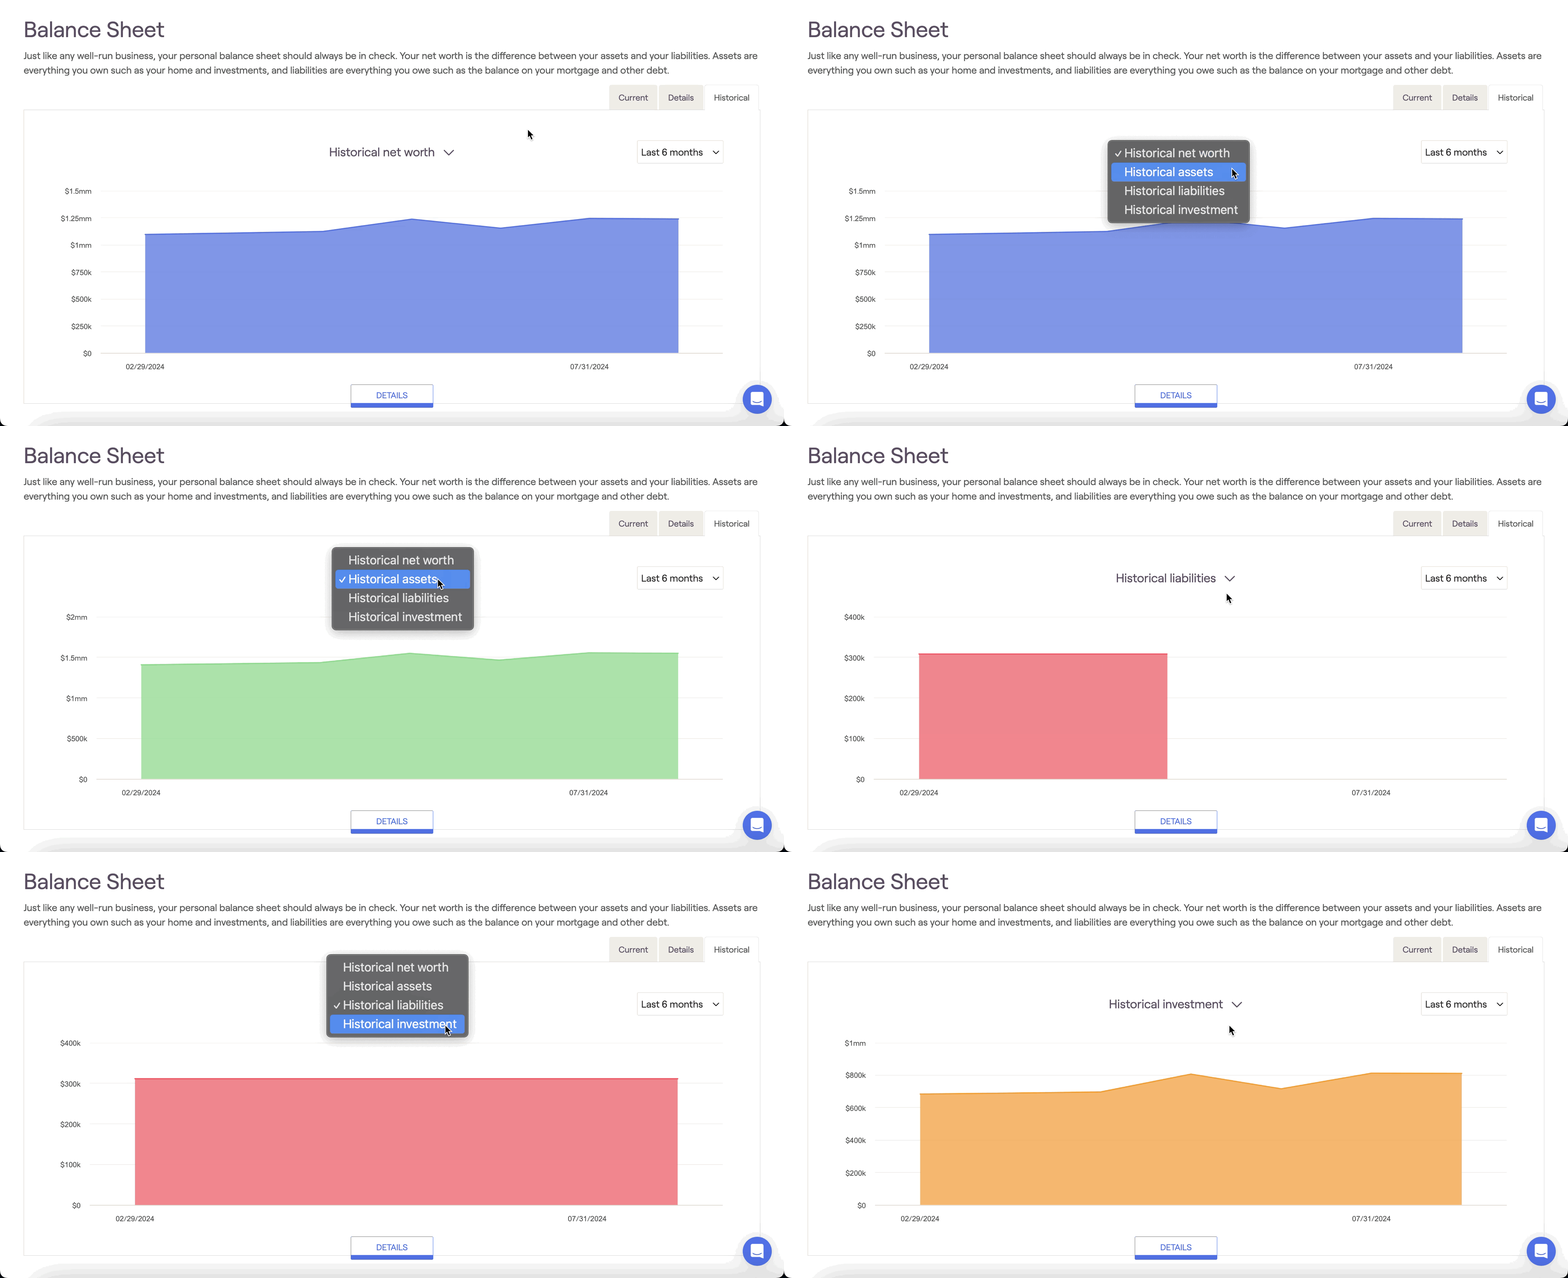
Historical
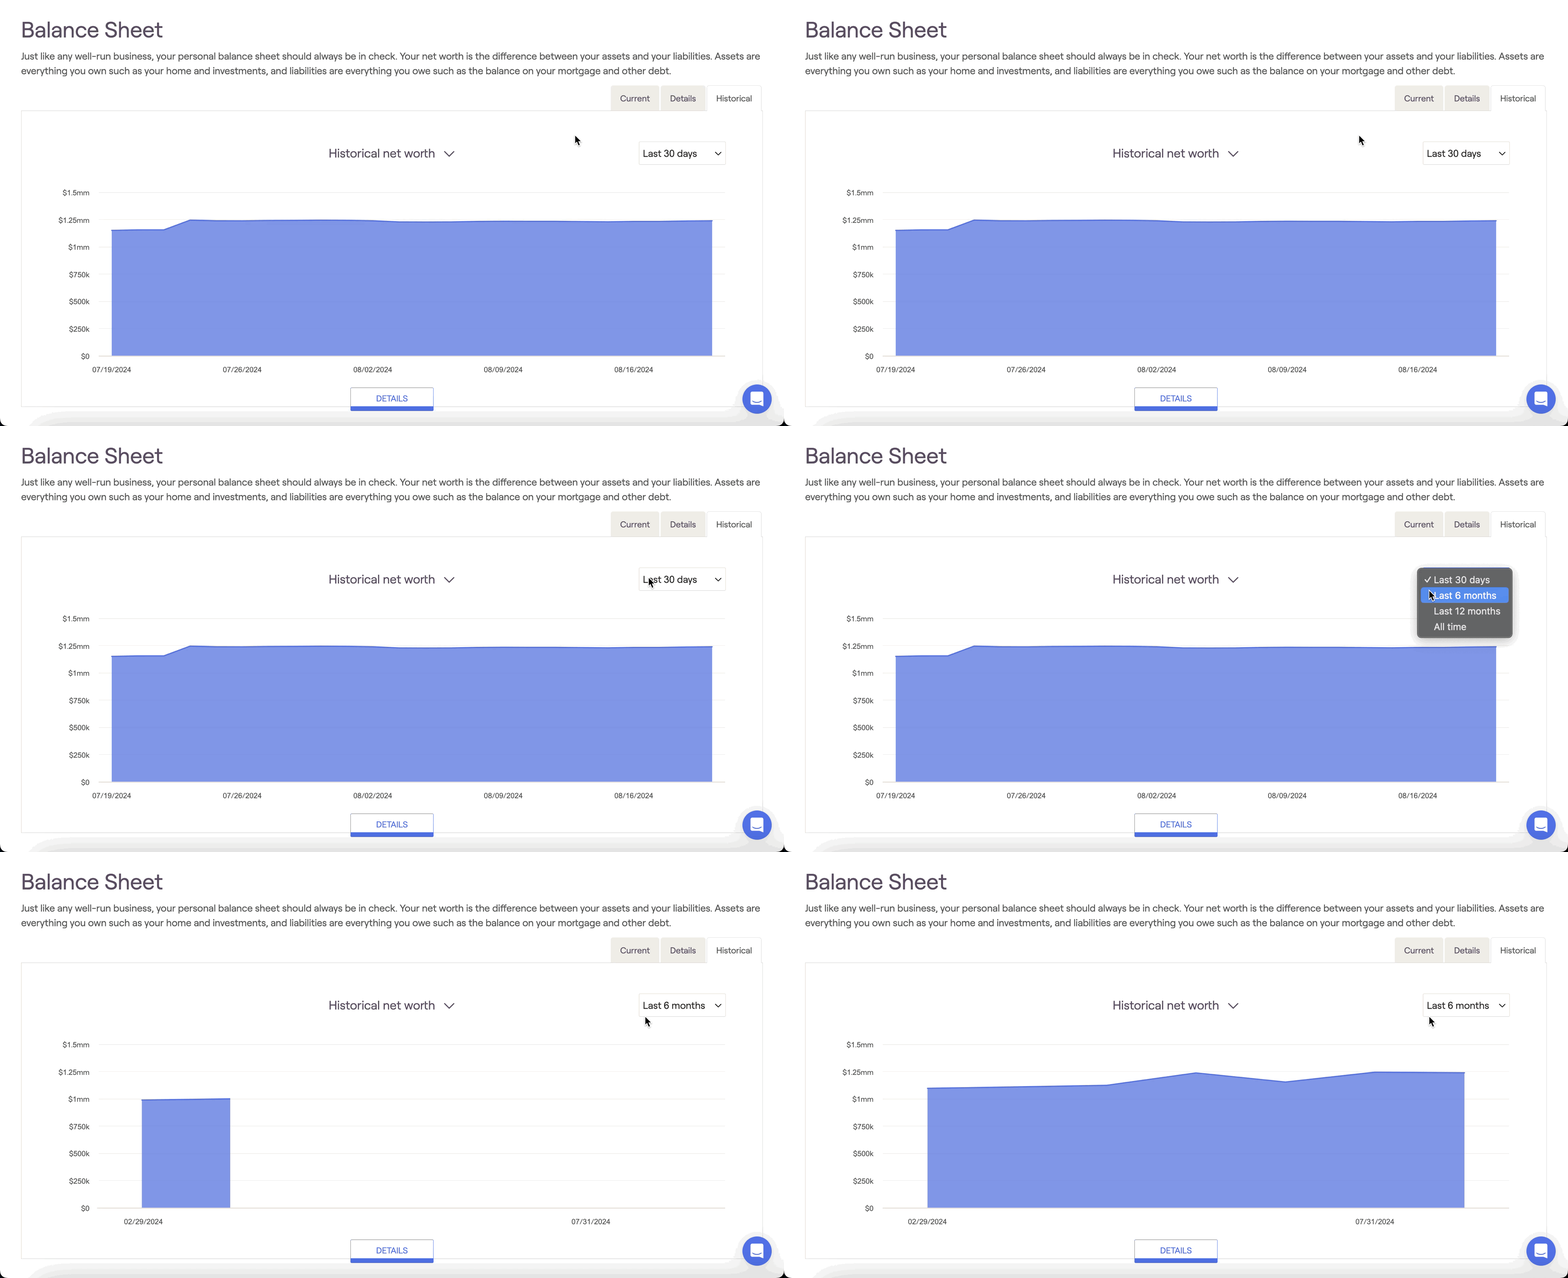
'Last 30 days' will show daily values from the prior 30 days. Hover your mouse over the chart to view dollar values at various points in time. The 'Last 6 months', 'Last 12 months', and 'All time' options will show month-end values over the respective time periods, as well as the current value to the far right of the chart. Please note that the 'All time' option reflects values dating back as far as January 31, 2018.
The chart timing defaults to the last 12 months; you can adjust the default for new clients within the Client Settings > Client Presets tab of your advisor portal.
