The Retirement > Social Security > Comparison tab in each client plan allows you to directly compare any two filing strategies, and examine both the annual and cumulative income amounts:

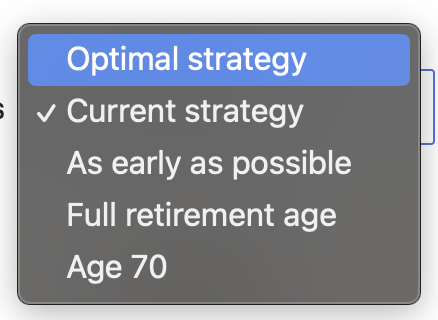
You can select the two filing strategies you wish to compare using the drop-down menus at the top right of the graph:

The value displayed on the right-hand side of the chart is the total difference in cumulative income received between the two selected filing strategies.
Filing Strategies
The Social Security filing options include the Optimal strategy, the Current strategy, As early as possible, Full retirement age, and Age 70.
The Optimal Strategy is calculated on a per-client basis to maximize the dollars the client(s) will receive through Social Security (more on this strategy below).
Current strategy
The Current Strategy reflects the filing age and benefit amount entered within the Profile > Income > Social Security card(s). For more information on how to enter Social Security benefits, click here.
As early as possible
Selecting As early as possible will see the client(s) file at age 62. For clients who are already past the age of 62, it will see them file right away within the plan, based on their current age. Early filing penalties will be factored in when using this option.
Full retirement age
Selecting Full retirement age will see the client(s) file at FRA, based on the birthday(s) entered in the Profile > Family section (you can find a client's FRA by birth year in the full retirement age chart).
Age 70
Selecting Age 70 will see the client(s) file at age 70. Delay credits will be factored in when using this option.
Annual Comparison
The first chart you will see in the Comparison tab is the Annual Cash Flow Comparison chart. This chart will directly compare the annual income amounts between your two selected filing strategies, starting in the first year of retirement and ending in the final year of the plan. By hovering your mouse over the chart, you can see a breakdown of the annual payment amounts for each filing strategy, for each year of the plan. The ages listed on the x-axis of the chart are that of the first client in the plan.
Break-Even Point
A secondary chart, the Cumulative Cash Flow Comparison, is also available within the Comparison tab. This chart will directly compare the cumulative income between your two selected filing strategies. By hovering your mouse over the chart, you can see a breakdown of the cumulative income for each filing strategy, for each year of the plan. The key metric to the right of the chart will display the break even point between the two filing strategies.
To switch charts, click the dropdown arrow next to the title at the top of the chart, and select the Cumulative cash flow comparison.