Equity compensation can be confusing, and clients can sometimes have difficulty weighing their options and visualizing their current stock plan situation. RightCapital's dedicated Stock Plans module simplifies this process, providing deeper insight into a client's current grants and giving advisors powerful tools to analyze, present, and even improve a client's stock plan strategy.
Advisors can access RightCapital's dedicated Stock Plan module within the °°° More Menu > Stock Plans tab of a client plan.
Key Takeaways
Analyze stock plans and individual grants on a more granular level, within the context of a comprehensive financial plan.
Present key information and metrics to clients using clean, easy-to-understand visuals and charts.
Demonstrate the long-term benefits of specific exercise and liquidation strategies as part of a Proposed Stock Plan Strategy.
This module will only display information if one or more stock plans are entered into the client's Profile > Net Worth section. For more information on entering stock plans in RightCapital, please click here.
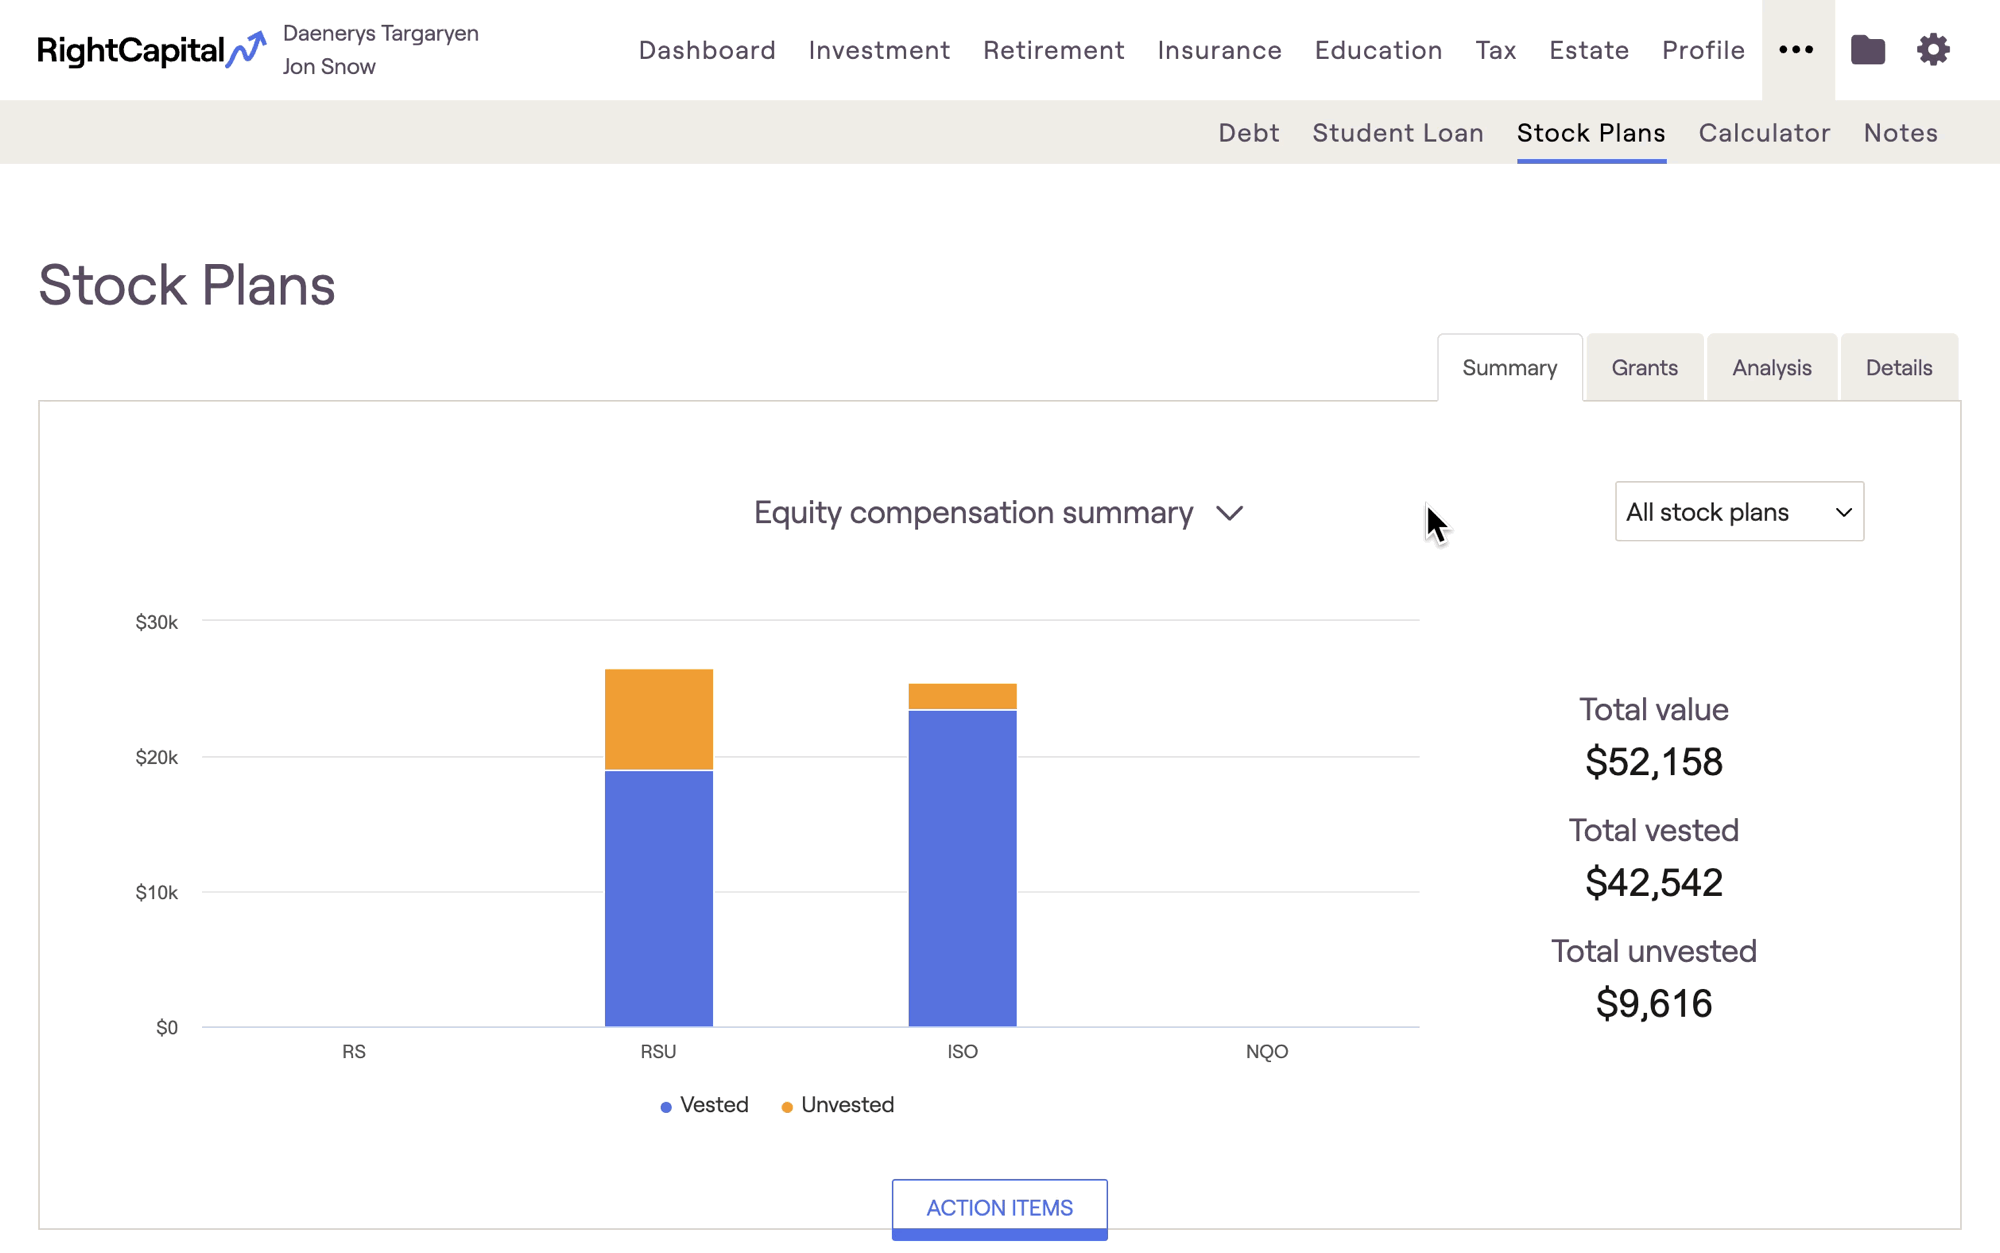
The Summary tabprovides key visuals and metrics related to the client's existing options and grants. If a client has more than one stock plan, advisors can toggle between "All Stock Plans" or individual stock plans using the dropdown menu in the upper right. Two charts can be viewed here: the Equity Compensation Summary chart, and the Equity Compensation Share Vesting chart.
This chart illustrates the value of the client's current vested and unvested shares, separated out by individual grant type. Key metrics to the right of the chart include the dollar value of vested, unvested, and total shares across one or more stock plans. Advisors can hover their mouse over the graph to view the vested/unvested dollar value of shares for each grant type.
This chart reflects the client's vested/unvested shares as of today. The dollar value of future grants will not be reflected in these totals.
This chart shows the number of vested and unvested shares each year, projected out into the future. The key metric to the right of the chart will help advisors quickly identify the year in which all shares finish vesting. Advisors can hover their mouse over the graph to view a breakdown of vested/unvested shares in a specific year. This chart does include future grants.
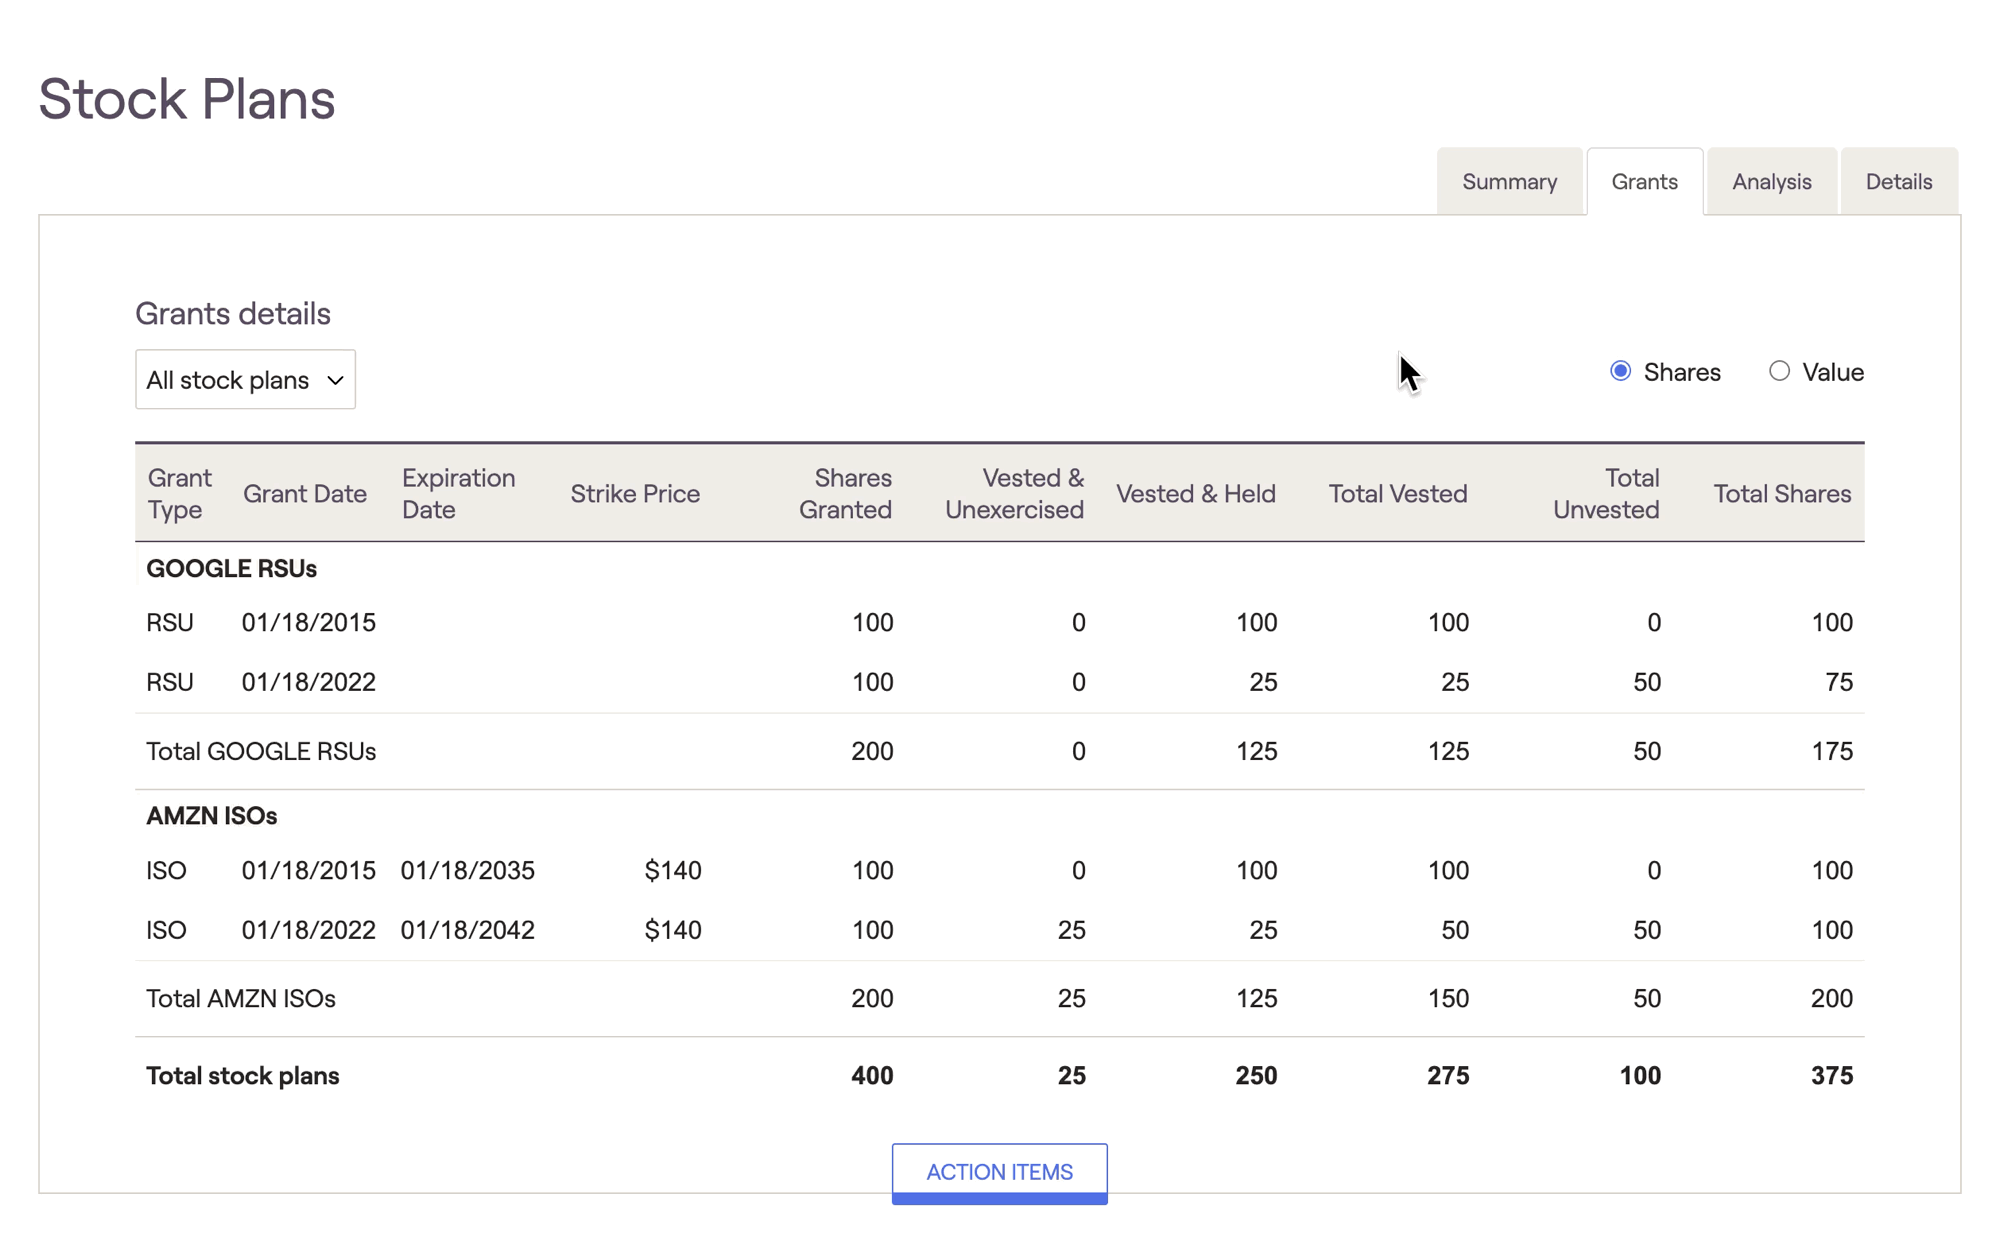
The Grants tab provides a more detailed look at a client's current stock plan situation, by consolidating all of a client's current grants into a single table. Advisors can toggle between "All Stock Plans" or individual stock plans using the dropdown menu in the upper left.
Grant Dates
Like the Equity Compensation Summary, this table provides information on the client's grants as of today (with a past grant date). This is in contrast to the Details tab, which shows an annualized figure summarizing any grants in the current year.
Analyze Key Grant Details
This table includes details to help clients better understand the status of their current grants, such as:
Grant type and grant date, for all grants
Expiration date and strike price, for ISOs and NQOs
Shares that have vested, but are unexercised
Shares that have vested and exercised, and are being held within the stock plan
Total vested and unvested shares, per grant
Toggle Between "Shares" and "Value"
Using the radio buttons in the upper right, advisors can toggle between the viewing Number of Shares, and viewing the Dollar Value of Shares, in this table. This allows advisors to quickly determine the monetary value of a client's shares as of today.
When calculating the dollar value of shares, RightCapital will multiply the stock's current price by the number of shares. The value of unexercised NQOs and ISOs will be reduced by the cost of exercise (strike price x number of shares)
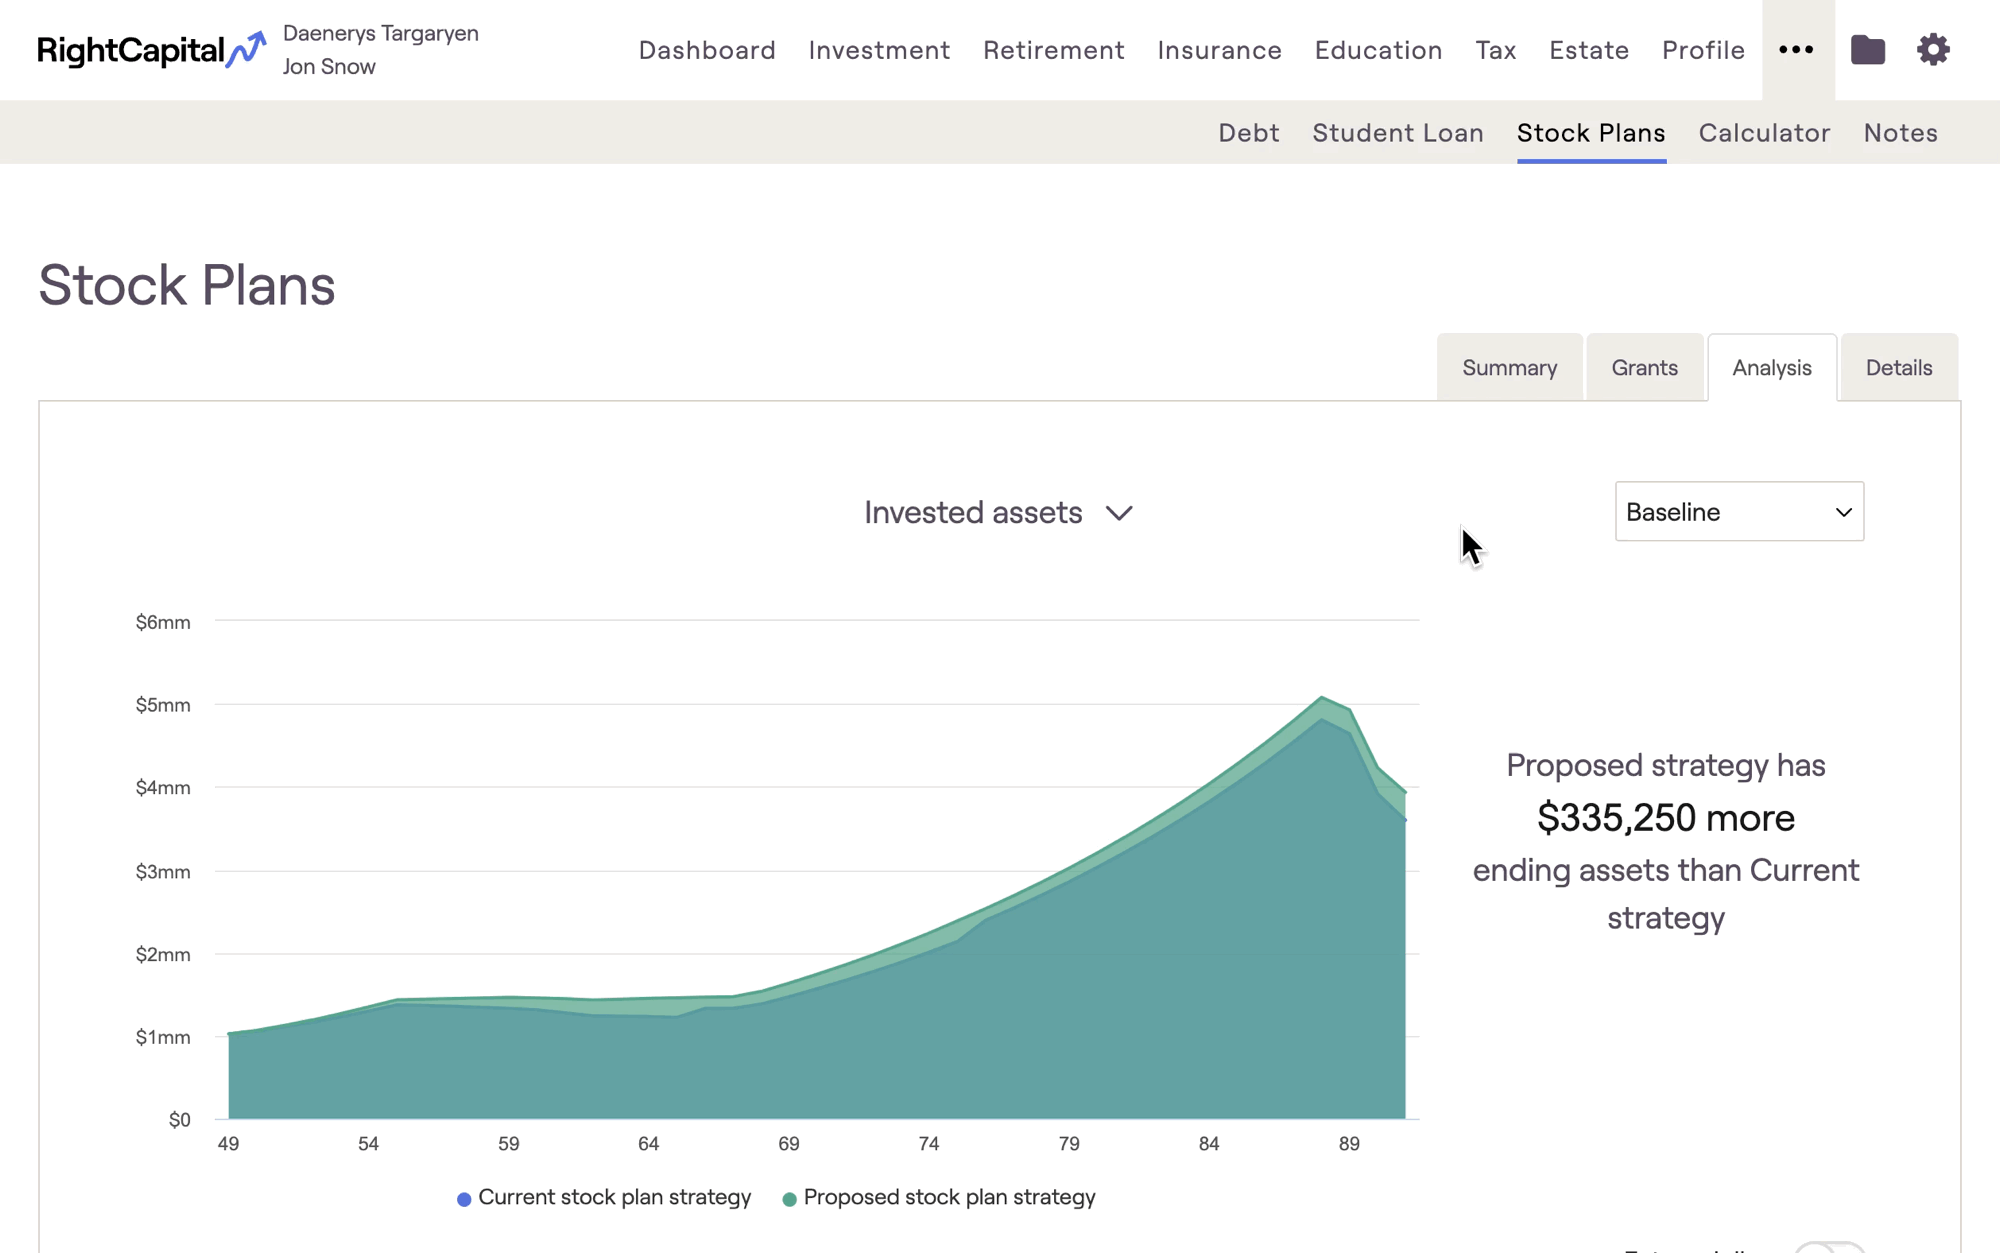
The Analysis tab is where advisors can compare a client's Current Stock Plan Strategy to their Proposed Stock Plan Strategy.
Current Strategy vs. Proposed Strategy
The Current Stock Plan Strategy is a direct reflection of the stock plan data entry inputs from the Profile > Net Worth section. This is used as the basis for the Proposed Strategy.
The Proposed Stock Plan Strategy incorporates any changes that are made to the stock plan inputs using the Action Items. (Jump to "Building a Proposed Strategy" for more details)
Within the Analysis tab, advisors can switch between future dollars and today's dollars using the toggle in the lower right corner. Four charts can be viewed here: Invested Assets, Taxes, Stock Plan Percentage of Portfolio, and Stock Plan Cash Flows.
This chart tracks the client's total invested assets over the course of their plan. The key metric to the right of the chart will highlight how much more/less in ending assets the client is projected to have when using the Proposed Strategy, compared to the Current Strategy. Advisors can hover their mouse over the graph to view invested asset totals on a yearly basis.
This chart tracks the client's total taxes paid over the course of their plan. The key metric to the right of the chart will highlight how much more/less in cumulative taxes the client is projected to pay during their lifetime when using the Proposed Strategy, compared to the Current Strategy. Advisors can hover their mouse over the graph to view projected tax payments on a yearly basis.
The Invested Assets and Taxes charts, which include comprehensive cash flow information, are based upon the Proposed Planfrom the Retirement > Analysis section.
This chart quantifies the value of a client's stock plan(s) as a percentage of their overall investment portfolio. This percentage is the dollar value of shares held (vested, exercised, but not liquidated) in relation to the client's total ending invested asset value each year. The key metric to the right of the chart highlights the peak, or maximum percentage, over the course of the Proposed Strategy. Advisors can hover their mouse over the graph to view specific percentages for the current and proposed strategies on a yearly basis.
This chart tracks the cash flow details of the client's stock plan(s), projected out into the future. The key metric to the right of the chart will highlight the total net flows over the course of the Proposed Stock Plan Strategy. Advisors can hover their mouse over the graph to view the stock plan net cash flows for the current and proposed strategies on a yearly basis.
In years where the cost of exercise outweighs the sale proceeds, negative net flows will be reflected and the chart will dip below the $0 line.
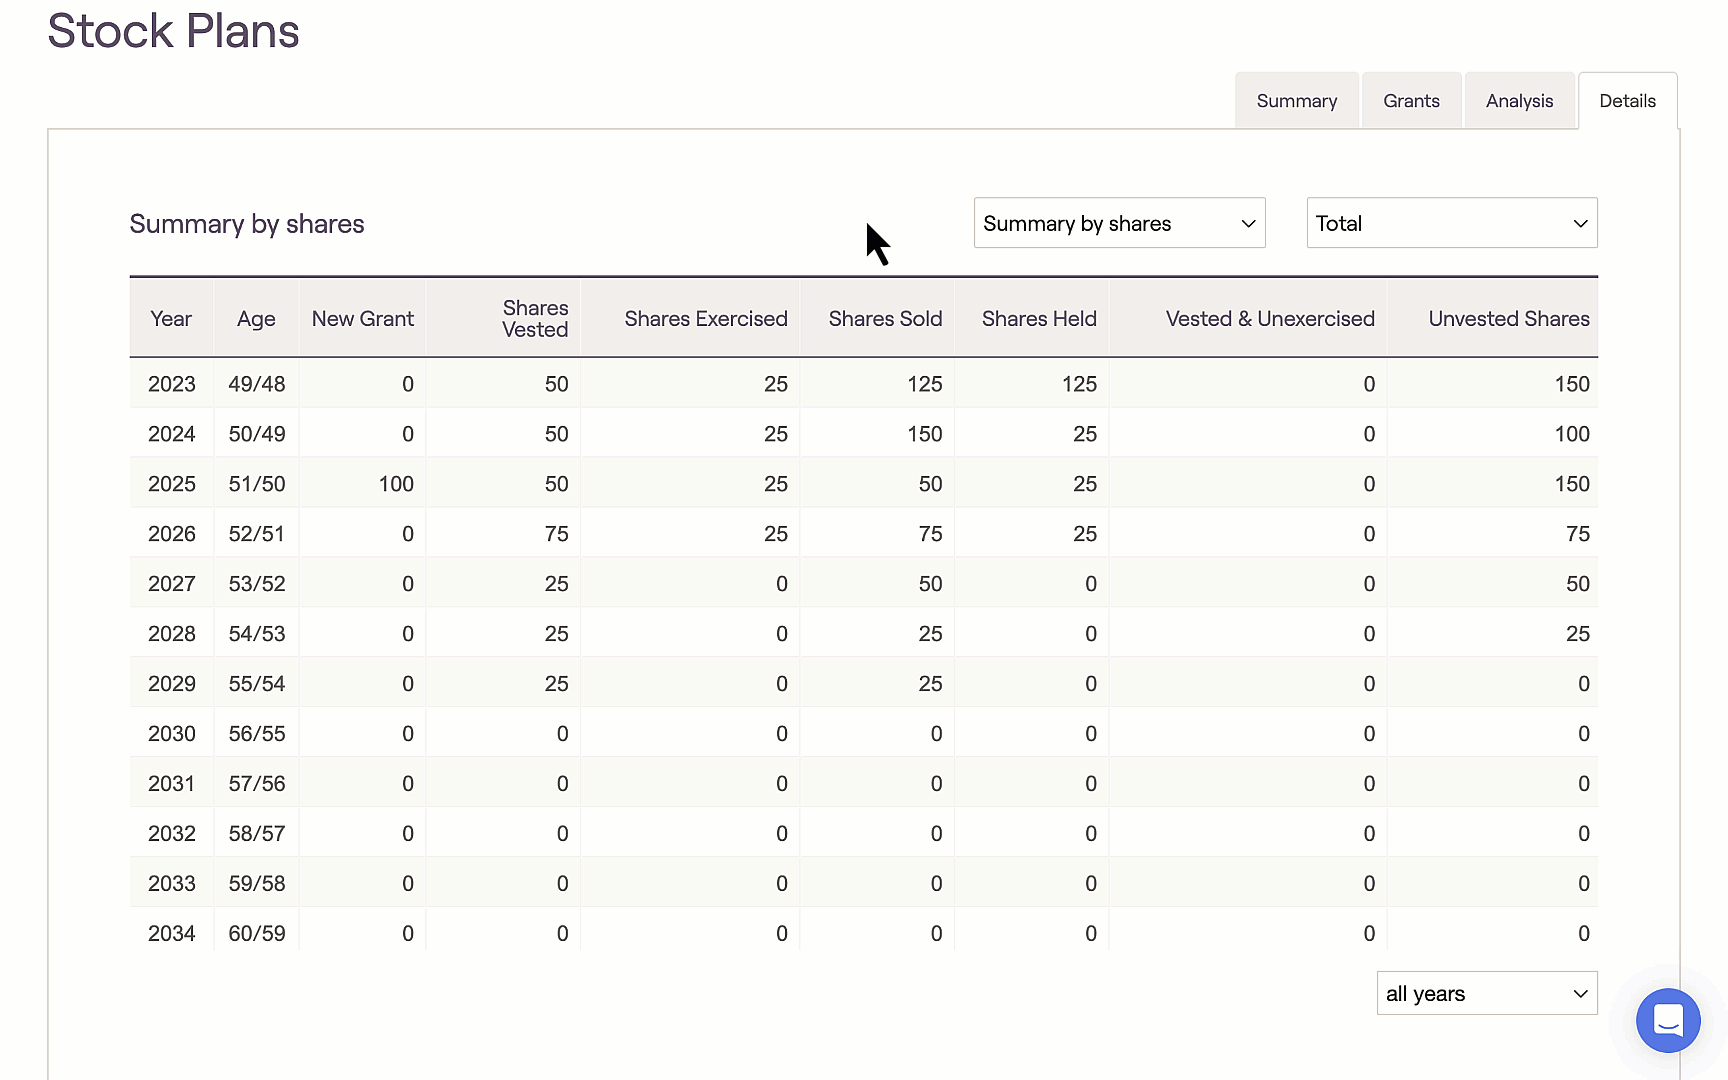
The Details Tab is where advisors can view a detailed cash flow breakdown of the Proposed Stock Plan Strategy on an individual grant level. Both past and future grants are included in these tables. Advisors can toggle between "Total" grants and individual grants using the dropdown in the upper right. Four cash flow tables are available here: Summary By Shares, Summary By Value, Cash Flows, and Taxes.
This table displays the number of shares that are granted, vested, exercised, sold, and held in each calendar year for the Proposed Stock Plan Strategy.
This table displays the dollar value of shares that are granted, vested, exercised, sold, and held in each calendar year for the Proposed Stock Plan Strategy.
The Cash Flows table will detail the cash inflows, cash outflows, and net cash flows for the Proposed Stock Plan Strategy. The Shares Exercised and Shares Sold columns both display the number of shares, while the Cost of Exercise, Sale Proceeds, and Net Cash Flows columns all display dollar values. This table ties directly back to the Stock Plan Cash Flows chart in the Analysis tab.
The Taxes table shows the dollar value of taxes paid on a yearly basis for the Proposed Stock Plan Strategy.
The different taxes generated are dependent on both grant type and liquidation strategy. For more information on how different grant types are taxed, please click here.
Advisors can demonstrate the value of implementing specific exercise and liquidation strategies by using the Action Items to build out a Proposed Stock Plan Strategy for their clients. The default Action Item selections are Exercise Strategy and Liquidation Strategy for all stock plans. Advisors can click the Edit button in the lower right corner to bring in additional items, such as Cashless Exercise, 83(b) Election, and the Custom Grant Strategy.
The Custom Grant Strategy item allows the Proposed Strategy to be customized on an individual grant level. To do this, switch the Custom Grant Strategy to "Yes", and click on "Use Plan Strategy" for any grant to specify the strategy details.
After clicking the Refresh button in the lower right, the Proposed Stock Plan Strategy will update to reflect the changes made in the Action Items. Advisors can use the Analysis tab to compare the Current and Proposed Strategies, as well as the Details tab to analyze the cash flow details for the Proposed Strategy.
Changes made to the Proposed Strategy in the Stock Plans module can be reflected instantly within any proposed plan in the Retirement section. To apply a Stock Plan Proposal, navigate to the Retirement > Analysis module, and scroll down to the Action Items at the bottom of the screen. In the right-hand column under Strategies, find the Stock Plan Strategy item, toggle from "Current Strategy" to "Stock Plan Proposal", and click the Refresh button in the lower right. This will cause the Proposed Stock Plan details from the Stock Plan module to be incorporated into your proposed plan.
If the Stock Plan Strategy is not listed in the Retirement > Analysis > Action Items, click the Edit button in the lower right, check the box for Stock Plan Strategy, and click Save.
For a visual walkthrough of the Stock Plan module, building a Proposed Stock Plan Strategy, and applying it to the Retirement > Analysis, feel free to watch our webinar on Optimizing Equity Compensation.
Contact Us
For additional assistance within RightCapital please contact our Support team.
Educational Webinars
RightCapital is committed to enabling your success. Each week, we cover essential planning modules and product updates.
RightCapital in Action
Check out our YouTube channel where we highlight Advisor Success Stories and share more Tips & Tricks!