Every RightCapital account will include a "default" glide path, which is pre-built and available for use within each client plan:

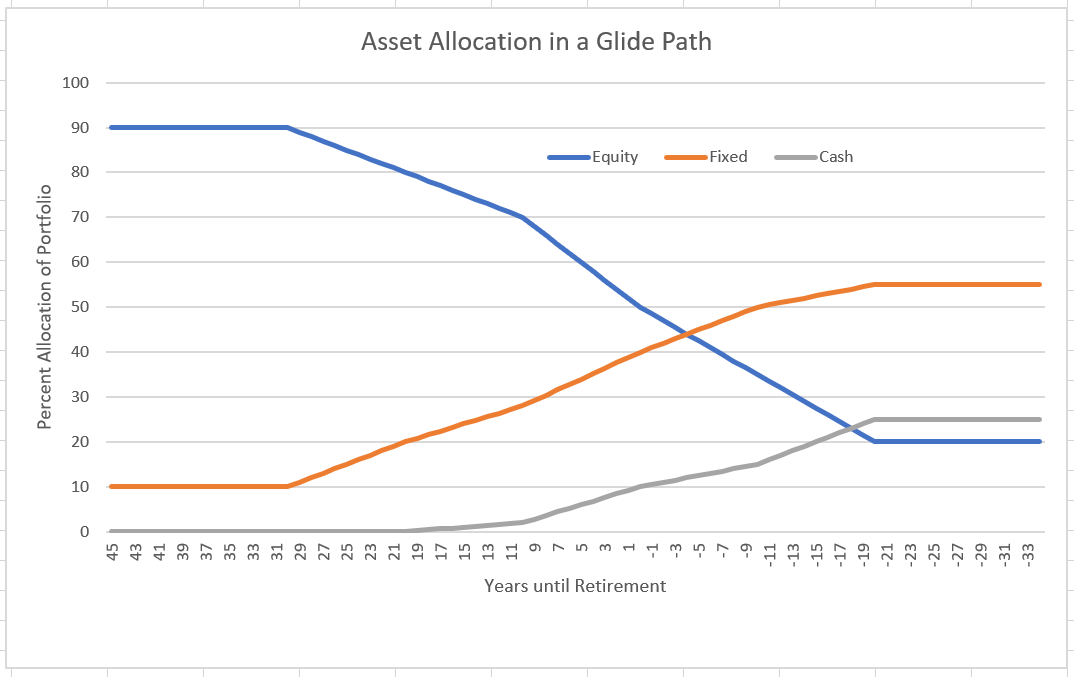
The Default glide path is derived based on the average glide path from some of the largest target retirement date funds including Fidelity, Vanguard, T. Rowe Price, Principal, American Funds, and Schwab. Below is the default glide path used:
Years to retirement | Equity | Fixed Income | Cash |
|---|---|---|---|
45 | 90.00% | 10.00% | 0.00% |
44 | 90.00% | 10.00% | 0.00% |
43 | 90.00% | 10.00% | 0.00% |
42 | 90.00% | 10.00% | 0.00% |
41 | 90.00% | 10.00% | 0.00% |
40 | 90.00% | 10.00% | 0.00% |
39 | 90.00% | 10.00% | 0.00% |
38 | 90.00% | 10.00% | 0.00% |
37 | 90.00% | 10.00% | 0.00% |
36 | 90.00% | 10.00% | 0.00% |
35 | 90.00% | 10.00% | 0.00% |
34 | 90.00% | 10.00% | 0.00% |
33 | 90.00% | 10.00% | 0.00% |
32 | 90.00% | 10.00% | 0.00% |
31 | 90.00% | 10.00% | 0.00% |
30 | 90.00% | 10.00% | 0.00% |
29 | 89.00% | 11.00% | 0.00% |
28 | 88.00% | 12.00% | 0.00% |
27 | 87.00% | 13.00% | 0.00% |
26 | 86.00% | 14.00% | 0.00% |
25 | 85.00% | 15.00% | 0.00% |
24 | 84.00% | 16.00% | 0.00% |
23 | 83.00% | 17.00% | 0.00% |
22 | 82.00% | 18.00% | 0.00% |
21 | 81.00% | 19.00% | 0.00% |
20 | 80.00% | 20.00% | 0.00% |
19 | 79.00% | 20.80% | 0.20% |
18 | 78.00% | 21.60% | 0.40% |
17 | 77.00% | 22.40% | 0.60% |
16 | 76.00% | 23.20% | 0.80% |
15 | 75.00% | 24.00% | 1.00% |
14 | 74.00% | 24.80% | 1.20% |
13 | 73.00% | 25.60% | 1.40% |
12 | 72.00% | 26.40% | 1.60% |
11 | 71.00% | 27.20% | 1.80% |
10 | 70.00% | 28.00% | 2.00% |
9 | 68.00% | 29.20% | 2.80% |
8 | 66.00% | 30.40% | 3.60% |
7 | 64.00% | 31.60% | 4.40% |
6 | 62.00% | 32.80% | 5.20% |
5 | 60.00% | 34.00% | 6.00% |
4 | 58.00% | 35.20% | 6.80% |
3 | 56.00% | 36.40% | 7.60% |
2 | 54.00% | 37.60% | 8.40% |
1 | 52.00% | 38.80% | 9.20% |
0 | 50.00% | 40.00% | 10.00% |
-1 | 48.50% | 41.00% | 10.50% |
-2 | 47.00% | 42.00% | 11.00% |
-3 | 45.50% | 43.00% | 11.50% |
-4 | 44.00% | 44.00% | 12.00% |
-5 | 42.50% | 45.00% | 12.50% |
-6 | 41.00% | 46.00% | 13.00% |
-7 | 39.50% | 47.00% | 13.50% |
-8 | 38.00% | 48.00% | 14.00% |
-9 | 36.50% | 49.00% | 14.50% |
-10 | 35.00% | 50.00% | 15.00% |
-11 | 33.50% | 50.50% | 16.00% |
-12 | 32.00% | 51.00% | 17.00% |
-13 | 30.50% | 51.50% | 18.00% |
-14 | 29.00% | 52.00% | 19.00% |
-15 | 27.50% | 52.50% | 20.00% |
-16 | 26.00% | 53.00% | 21.00% |
-17 | 24.50% | 53.50% | 22.00% |
-18 | 23.00% | 54.00% | 23.00% |
-19 | 21.50% | 54.50% | 24.00% |
-20 | 20.00% | 55.00% | 25.00% |
-21 | 20.00% | 55.00% | 25.00% |
-22 | 20.00% | 55.00% | 25.00% |
-23 | 20.00% | 55.00% | 25.00% |
-24 | 20.00% | 55.00% | 25.00% |
-25 | 20.00% | 55.00% | 25.00% |
-26 | 20.00% | 55.00% | 25.00% |
-27 | 20.00% | 55.00% | 25.00% |
-28 | 20.00% | 55.00% | 25.00% |
-29 | 20.00% | 55.00% | 25.00% |
-30 | 20.00% | 55.00% | 25.00% |
-31 | 20.00% | 55.00% | 25.00% |
-32 | 20.00% | 55.00% | 25.00% |
-33 | 20.00% | 55.00% | 25.00% |
-34 | 20.00% | 55.00% | 25.00% |
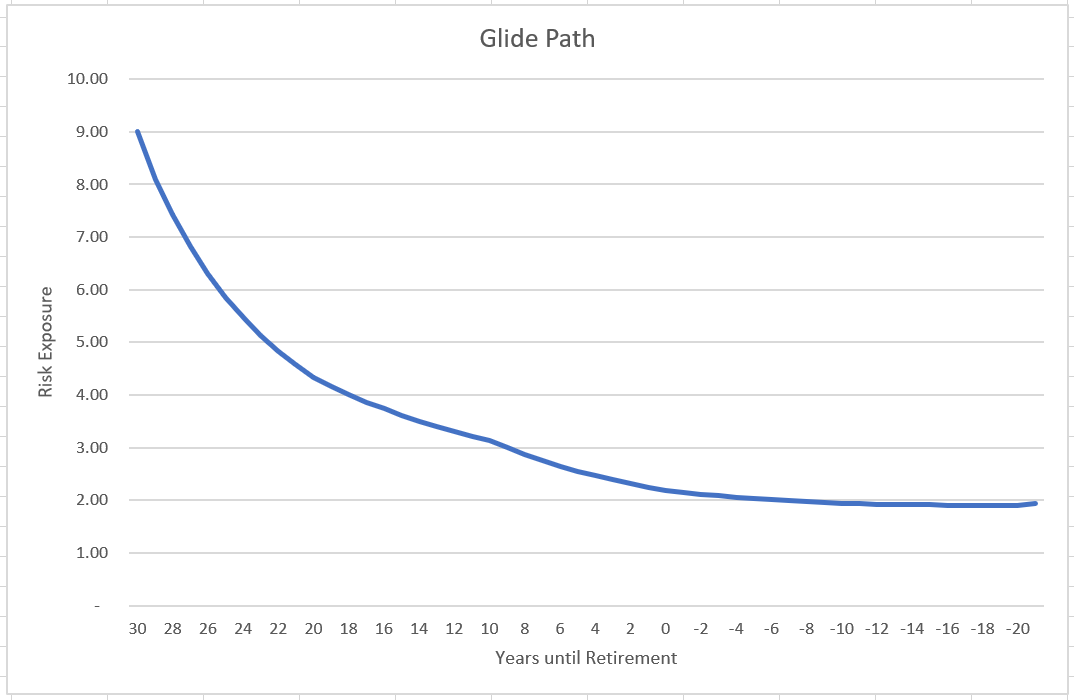
The two charts here illustrate the default glide path in RightCapital. The first graph indicates the risk exposure shift in the glide path allocation over time, from higher risk (more aggressive) to lower risk (more conservative). The "risk exposure" values are illustrative, as the actual risk exposure is determined by the specific holdings in the portfolio. The second graph illustrates the asset class allocation over time.


