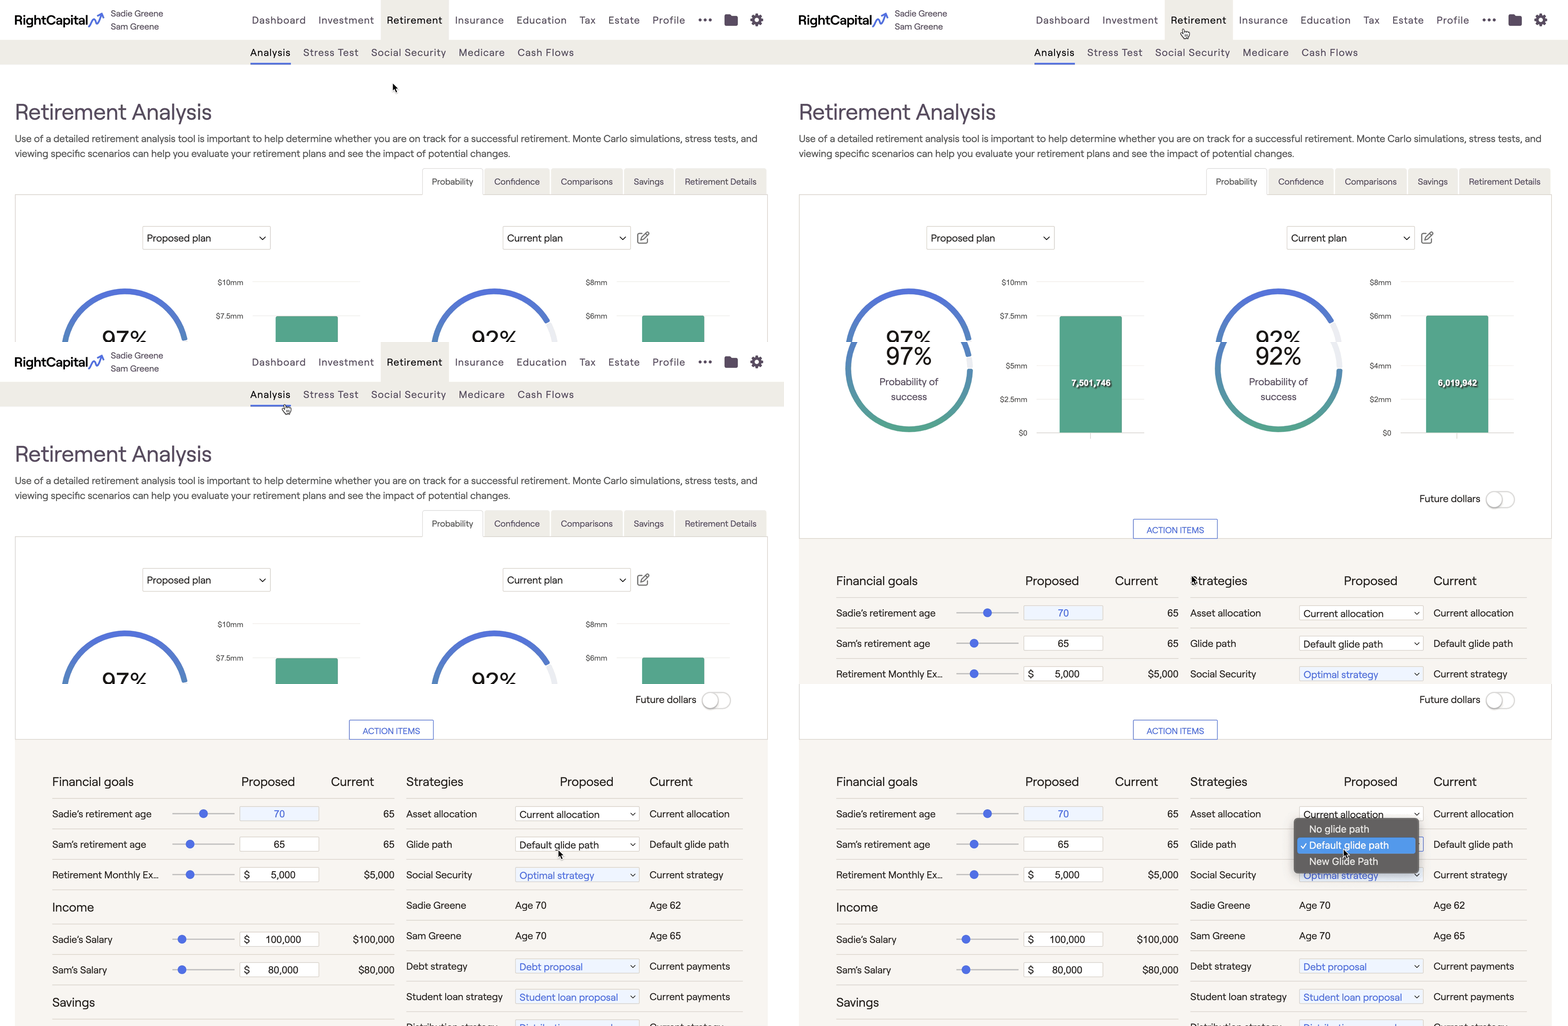
Glide paths are used to transition invested assets from high exposure to lower exposure allocations over time. Specifically, glide paths identify the percentage of a portfolio invested in equity, fixed income, and cash asset classes at a given year on the path. This enables you, as their advisor, to have a guide to transitioning a client's investment portfolio from more aggressive to more conservative, over time.
Default Glide Path
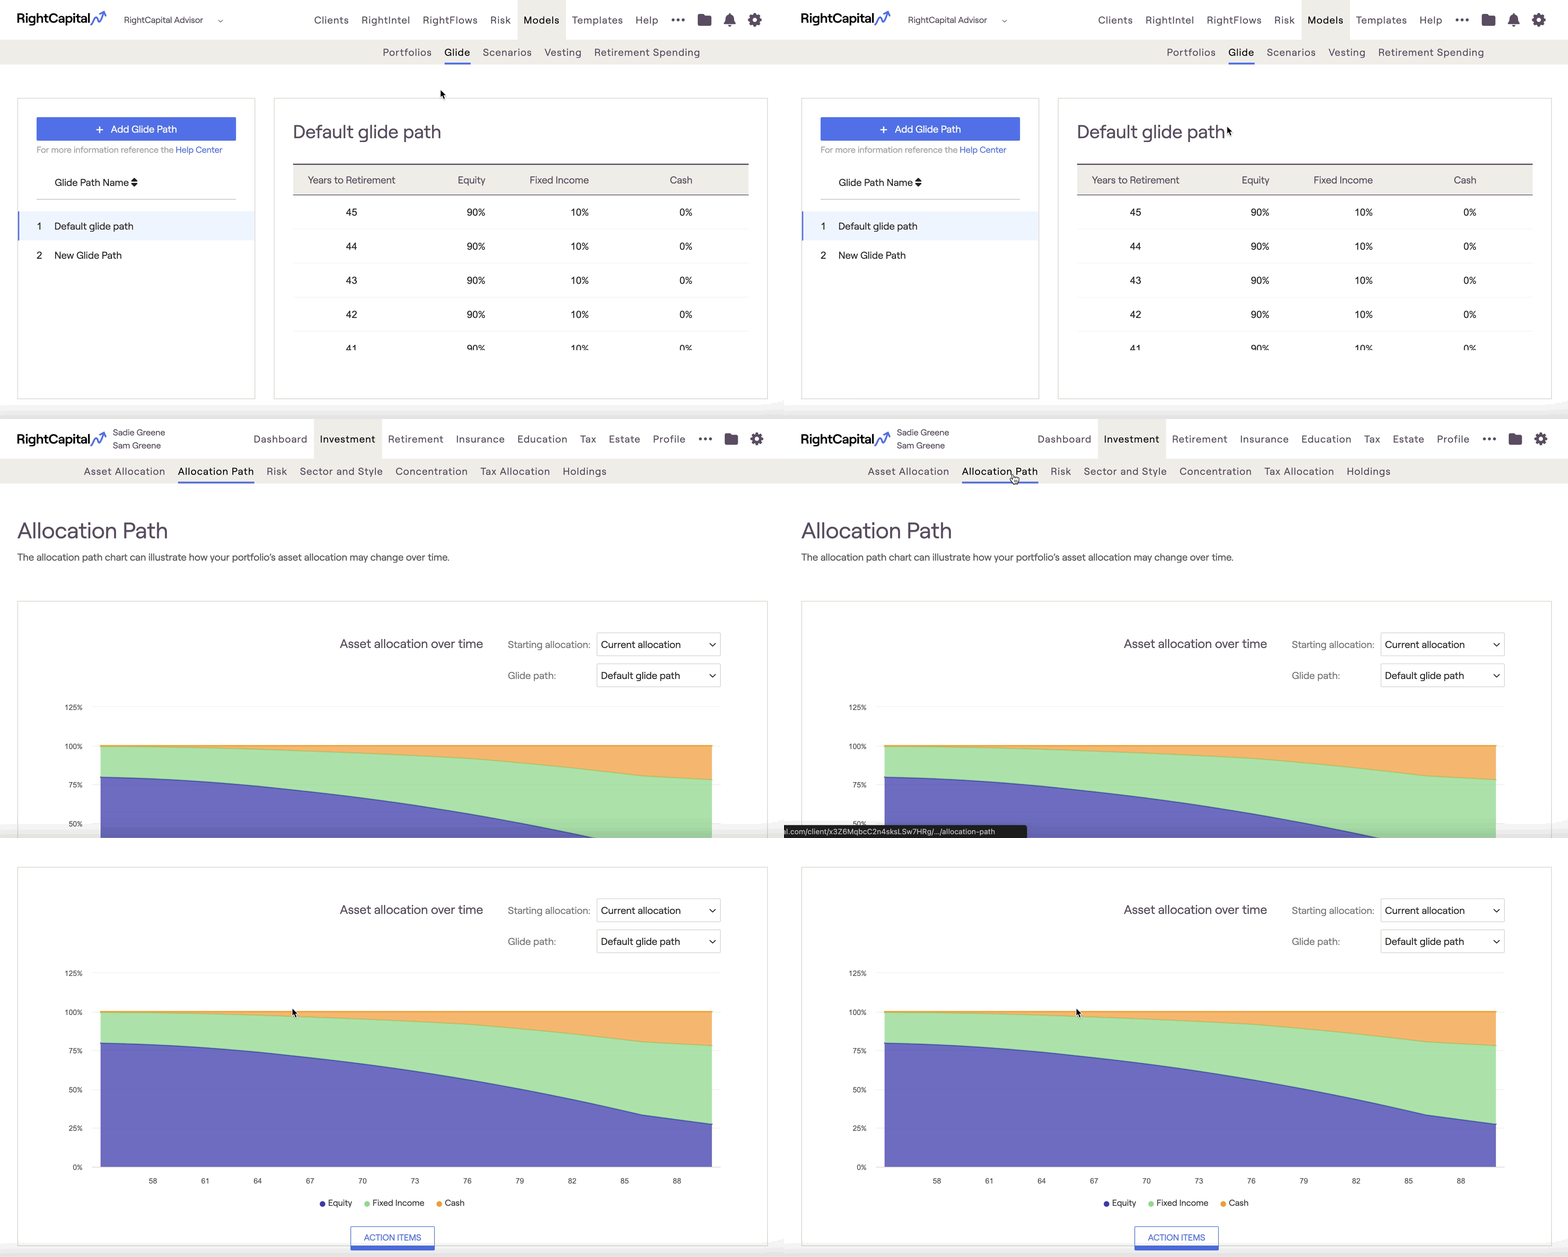
RightCapital includes a "default" glide path, which is pre-built into every advisor account. The Default glide path is derived based on the average glide path from some of the largest target retirement date funds including Fidelity, Vanguard, T. Rowe Price, Principal, American Funds, and Schwab. Below is the default glide path used:
Years to retirement | Equity | Fixed Income | Cash |
|---|---|---|---|
45 | 90.00% | 10.00% | 0.00% |
44 | 90.00% | 10.00% | 0.00% |
43 | 90.00% | 10.00% | 0.00% |
42 | 90.00% | 10.00% | 0.00% |
41 | 90.00% | 10.00% | 0.00% |
40 | 90.00% | 10.00% | 0.00% |
39 | 90.00% | 10.00% | 0.00% |
38 | 90.00% | 10.00% | 0.00% |
37 | 90.00% | 10.00% | 0.00% |
36 | 90.00% | 10.00% | 0.00% |
35 | 90.00% | 10.00% | 0.00% |
34 | 90.00% | 10.00% | 0.00% |
33 | 90.00% | 10.00% | 0.00% |
32 | 90.00% | 10.00% | 0.00% |
31 | 90.00% | 10.00% | 0.00% |
30 | 90.00% | 10.00% | 0.00% |
29 | 89.00% | 11.00% | 0.00% |
28 | 88.00% | 12.00% | 0.00% |
27 | 87.00% | 13.00% | 0.00% |
26 | 86.00% | 14.00% | 0.00% |
25 | 85.00% | 15.00% | 0.00% |
24 | 84.00% | 16.00% | 0.00% |
23 | 83.00% | 17.00% | 0.00% |
22 | 82.00% | 18.00% | 0.00% |
21 | 81.00% | 19.00% | 0.00% |
20 | 80.00% | 20.00% | 0.00% |
19 | 79.00% | 20.80% | 0.20% |
18 | 78.00% | 21.60% | 0.40% |
17 | 77.00% | 22.40% | 0.60% |
16 | 76.00% | 23.20% | 0.80% |
15 | 75.00% | 24.00% | 1.00% |
14 | 74.00% | 24.80% | 1.20% |
13 | 73.00% | 25.60% | 1.40% |
12 | 72.00% | 26.40% | 1.60% |
11 | 71.00% | 27.20% | 1.80% |
10 | 70.00% | 28.00% | 2.00% |
9 | 68.00% | 29.20% | 2.80% |
8 | 66.00% | 30.40% | 3.60% |
7 | 64.00% | 31.60% | 4.40% |
6 | 62.00% | 32.80% | 5.20% |
5 | 60.00% | 34.00% | 6.00% |
4 | 58.00% | 35.20% | 6.80% |
3 | 56.00% | 36.40% | 7.60% |
2 | 54.00% | 37.60% | 8.40% |
1 | 52.00% | 38.80% | 9.20% |
0 | 50.00% | 40.00% | 10.00% |
-1 | 48.50% | 41.00% | 10.50% |
-2 | 47.00% | 42.00% | 11.00% |
-3 | 45.50% | 43.00% | 11.50% |
-4 | 44.00% | 44.00% | 12.00% |
-5 | 42.50% | 45.00% | 12.50% |
-6 | 41.00% | 46.00% | 13.00% |
-7 | 39.50% | 47.00% | 13.50% |
-8 | 38.00% | 48.00% | 14.00% |
-9 | 36.50% | 49.00% | 14.50% |
-10 | 35.00% | 50.00% | 15.00% |
-11 | 33.50% | 50.50% | 16.00% |
-12 | 32.00% | 51.00% | 17.00% |
-13 | 30.50% | 51.50% | 18.00% |
-14 | 29.00% | 52.00% | 19.00% |
-15 | 27.50% | 52.50% | 20.00% |
-16 | 26.00% | 53.00% | 21.00% |
-17 | 24.50% | 53.50% | 22.00% |
-18 | 23.00% | 54.00% | 23.00% |
-19 | 21.50% | 54.50% | 24.00% |
-20 | 20.00% | 55.00% | 25.00% |
-21 | 20.00% | 55.00% | 25.00% |
-22 | 20.00% | 55.00% | 25.00% |
-23 | 20.00% | 55.00% | 25.00% |
-24 | 20.00% | 55.00% | 25.00% |
-25 | 20.00% | 55.00% | 25.00% |
-26 | 20.00% | 55.00% | 25.00% |
-27 | 20.00% | 55.00% | 25.00% |
-28 | 20.00% | 55.00% | 25.00% |
-29 | 20.00% | 55.00% | 25.00% |
-30 | 20.00% | 55.00% | 25.00% |
-31 | 20.00% | 55.00% | 25.00% |
-32 | 20.00% | 55.00% | 25.00% |
-33 | 20.00% | 55.00% | 25.00% |
-34 | 20.00% | 55.00% | 25.00% |
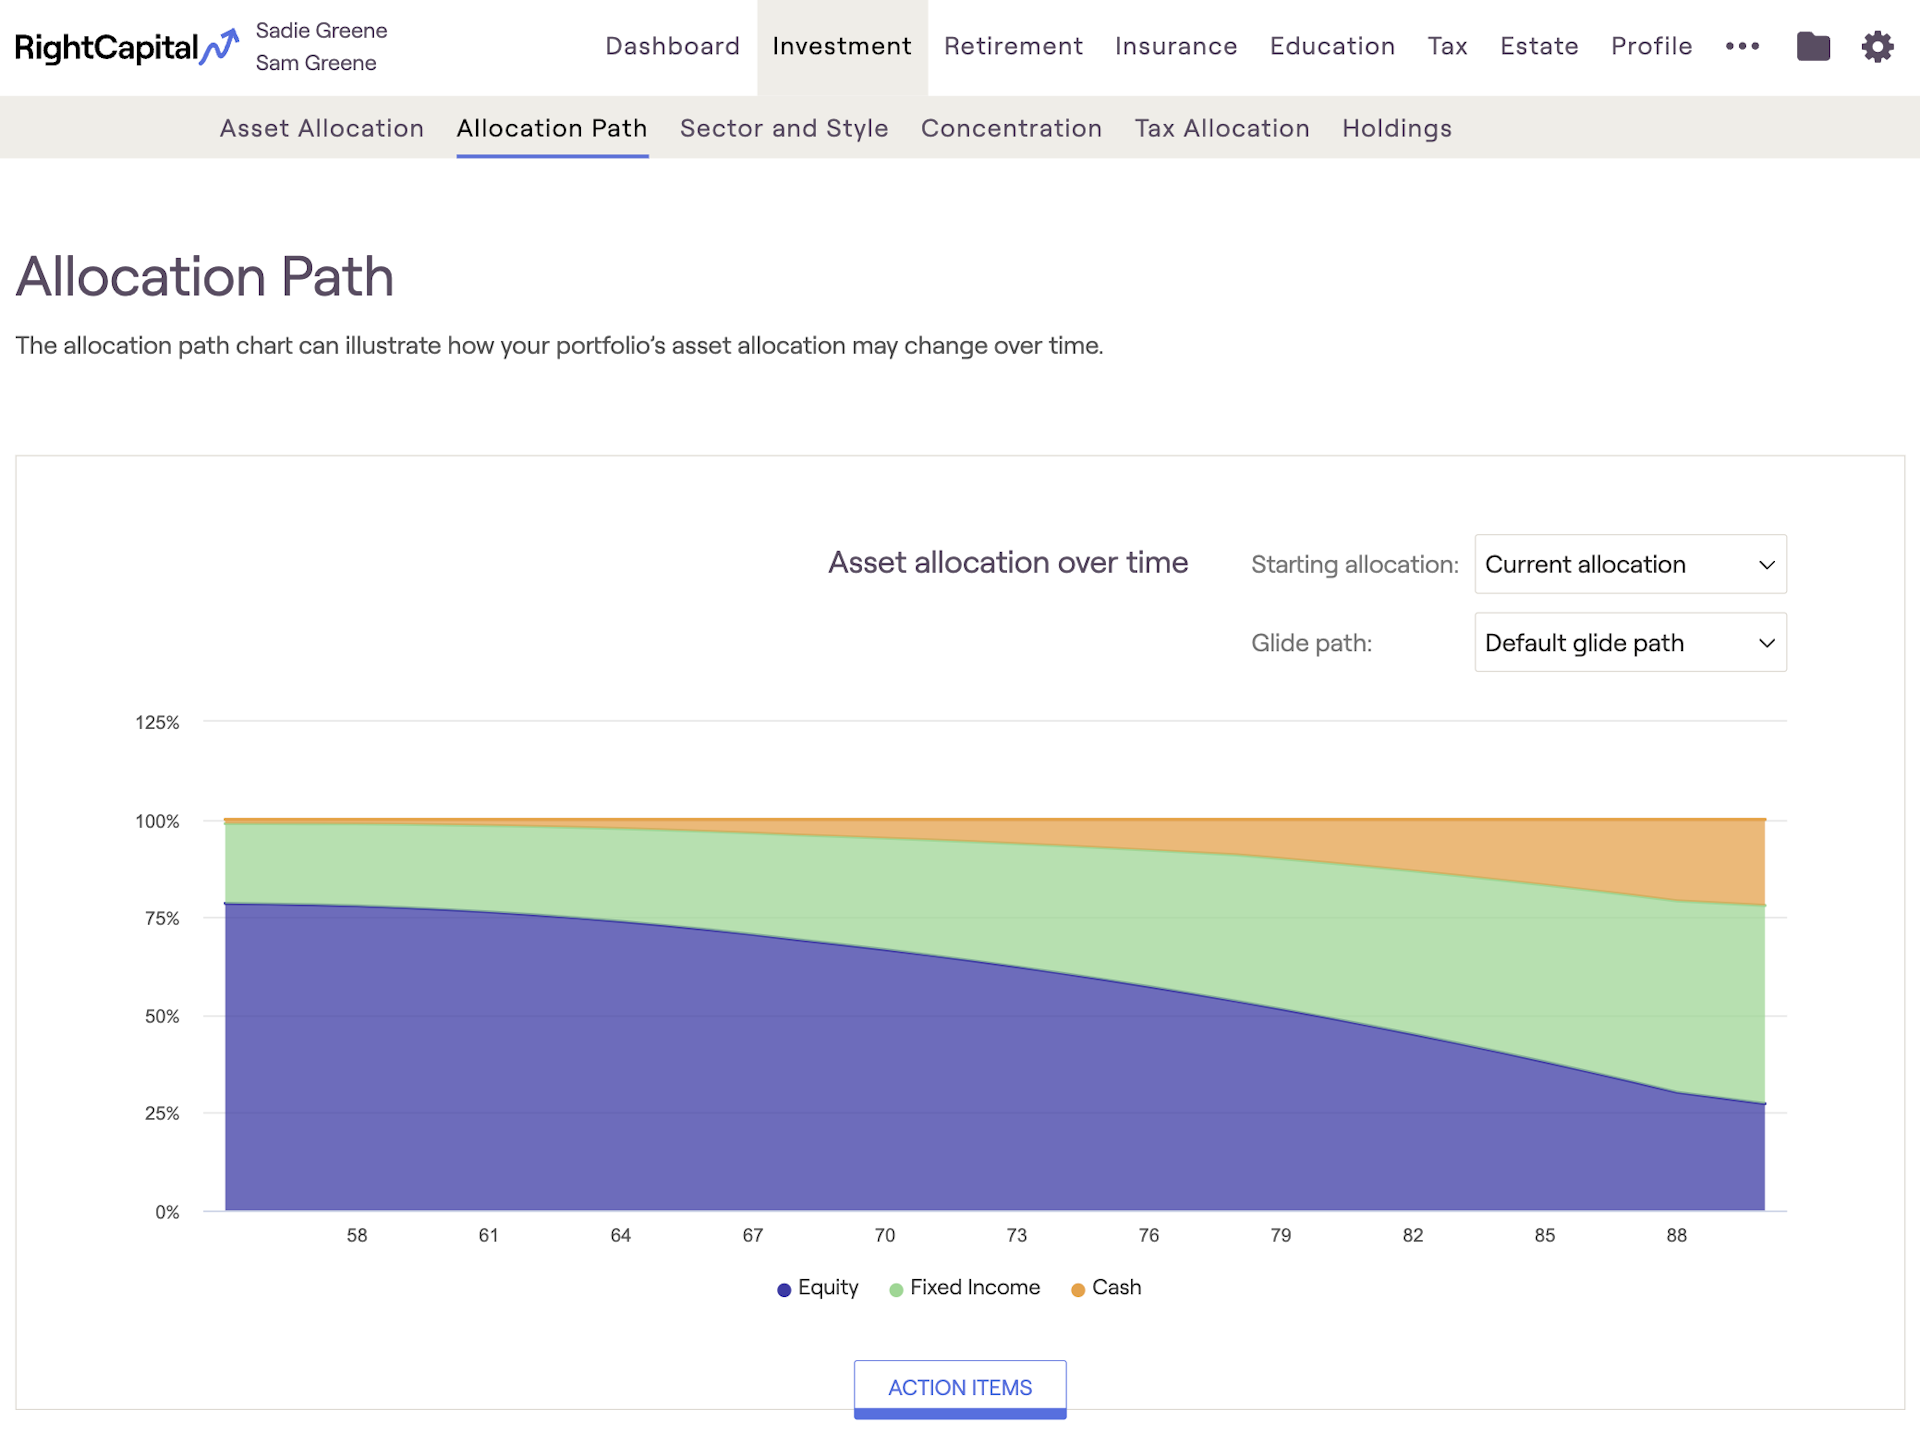
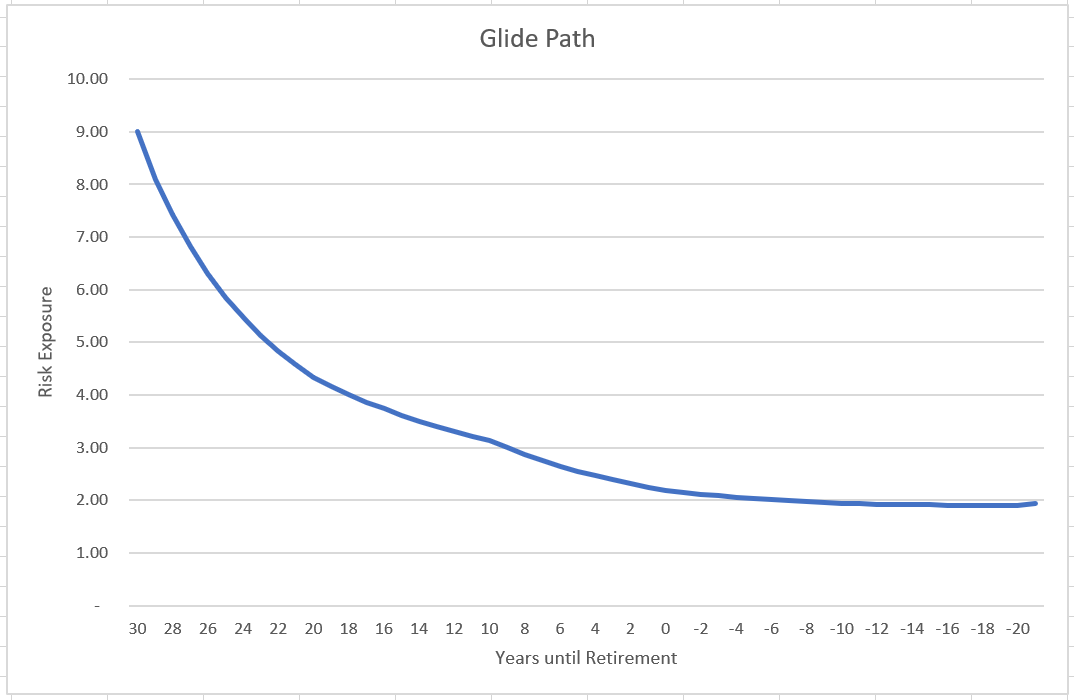
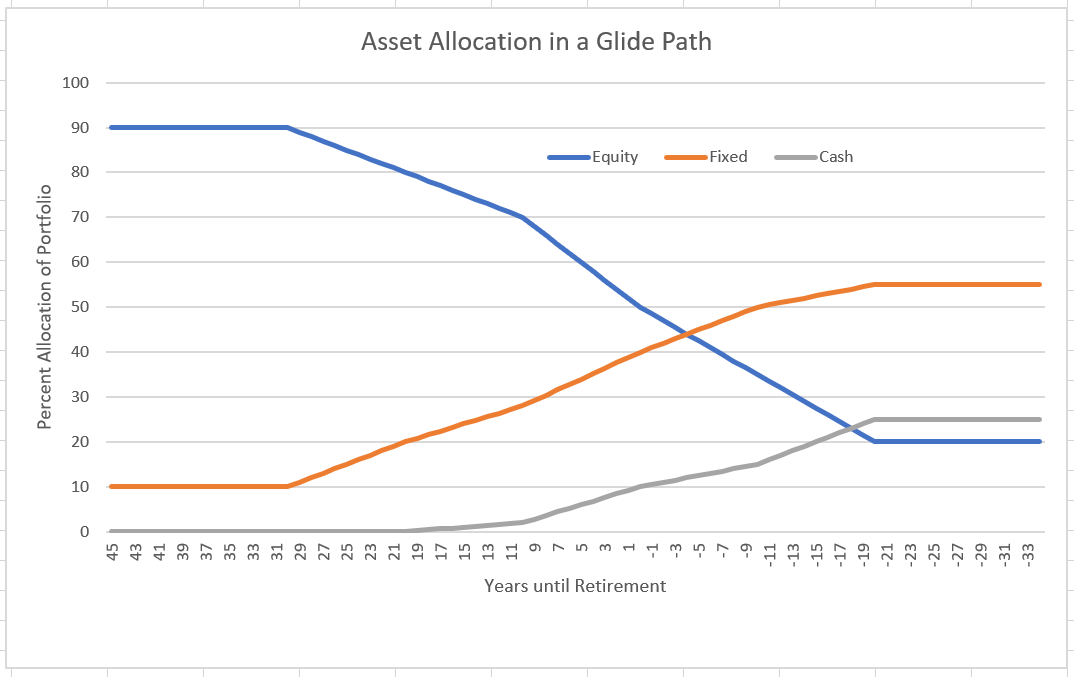
The two charts here illustrate the default glide path in RightCapital. The first graph indicates the risk exposure shift in the glide path allocation over time, from higher risk (more aggressive) to lower risk (more conservative). The "risk exposure" values are illustrative, as the actual risk exposure is determined by the specific holdings in the portfolio. The second graph illustrates the asset class allocation over time.
Creating Custom Glide Paths
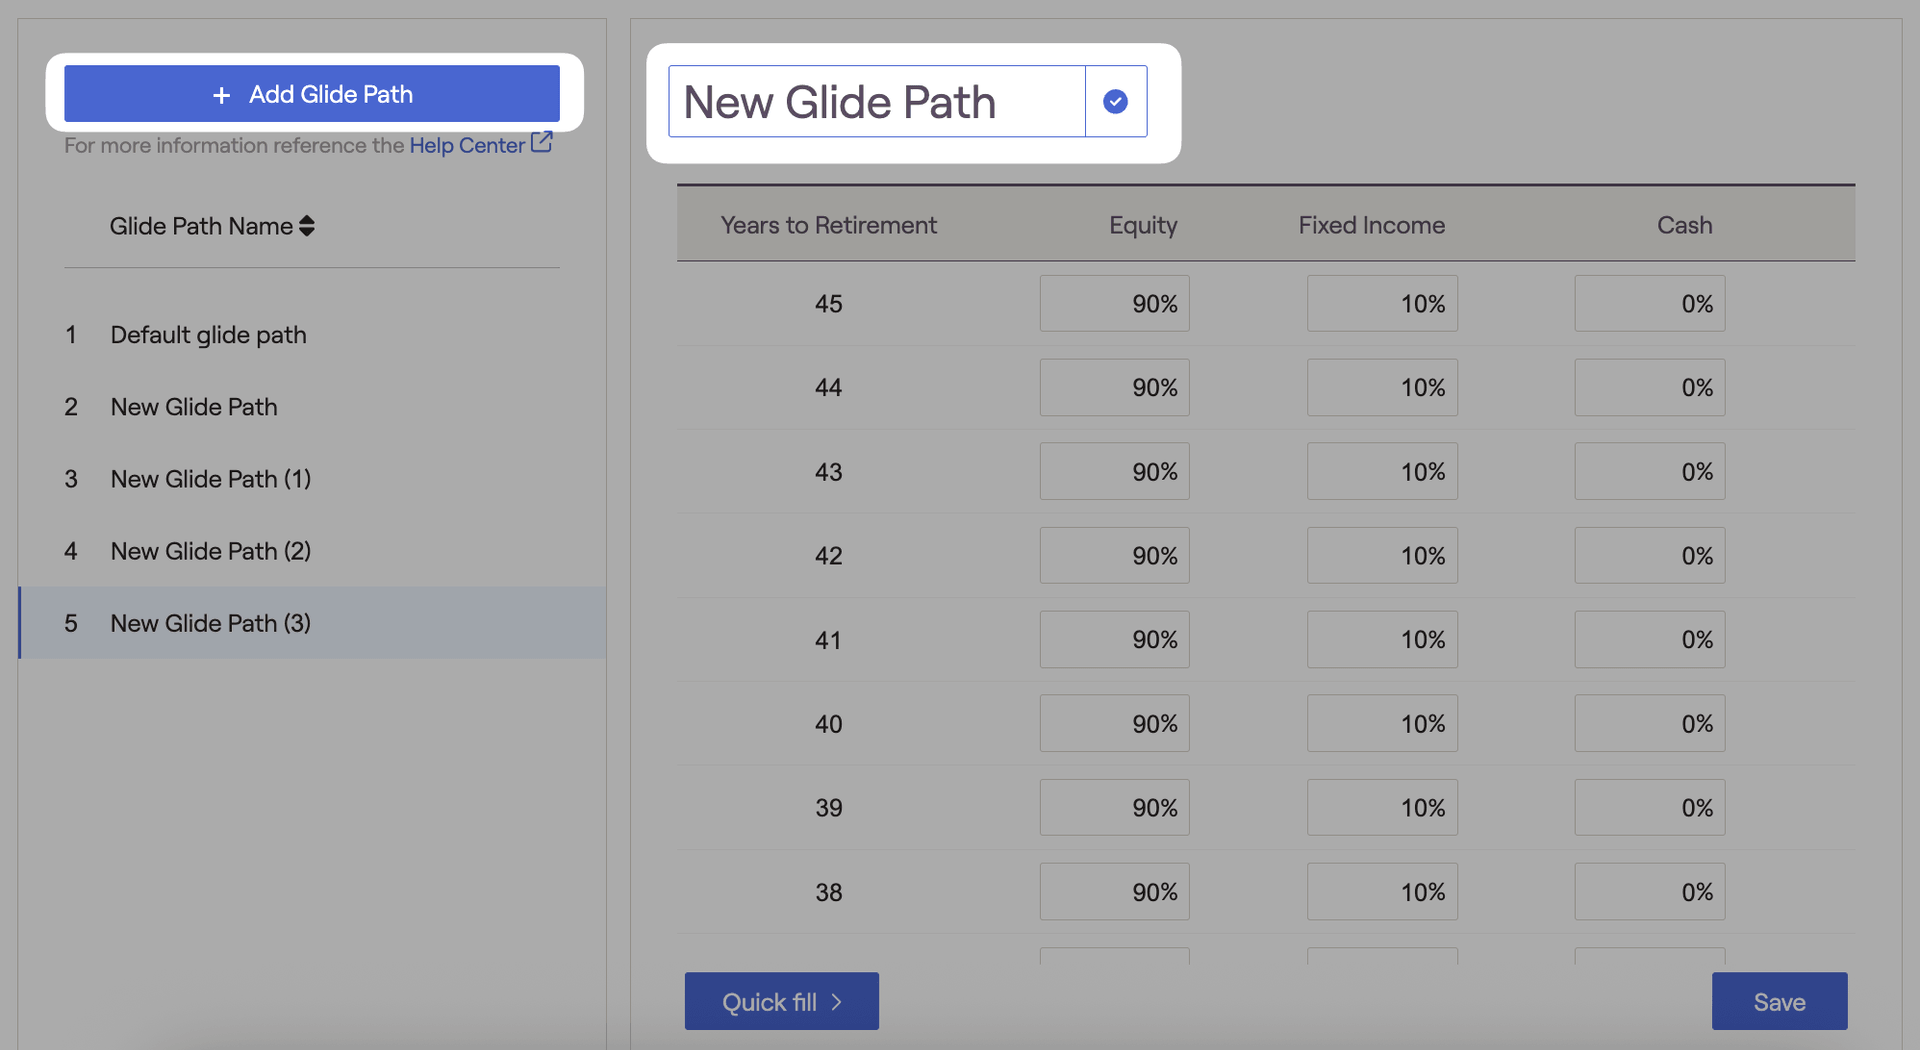

The years reflect the period until retirement. Positive numbers are before retirement (e.g. Year 15 reflects 15 years before retirement) and negative numbers are after retirement (e.g. Year -5 reflects 5 years after retirement).
Quick Fill
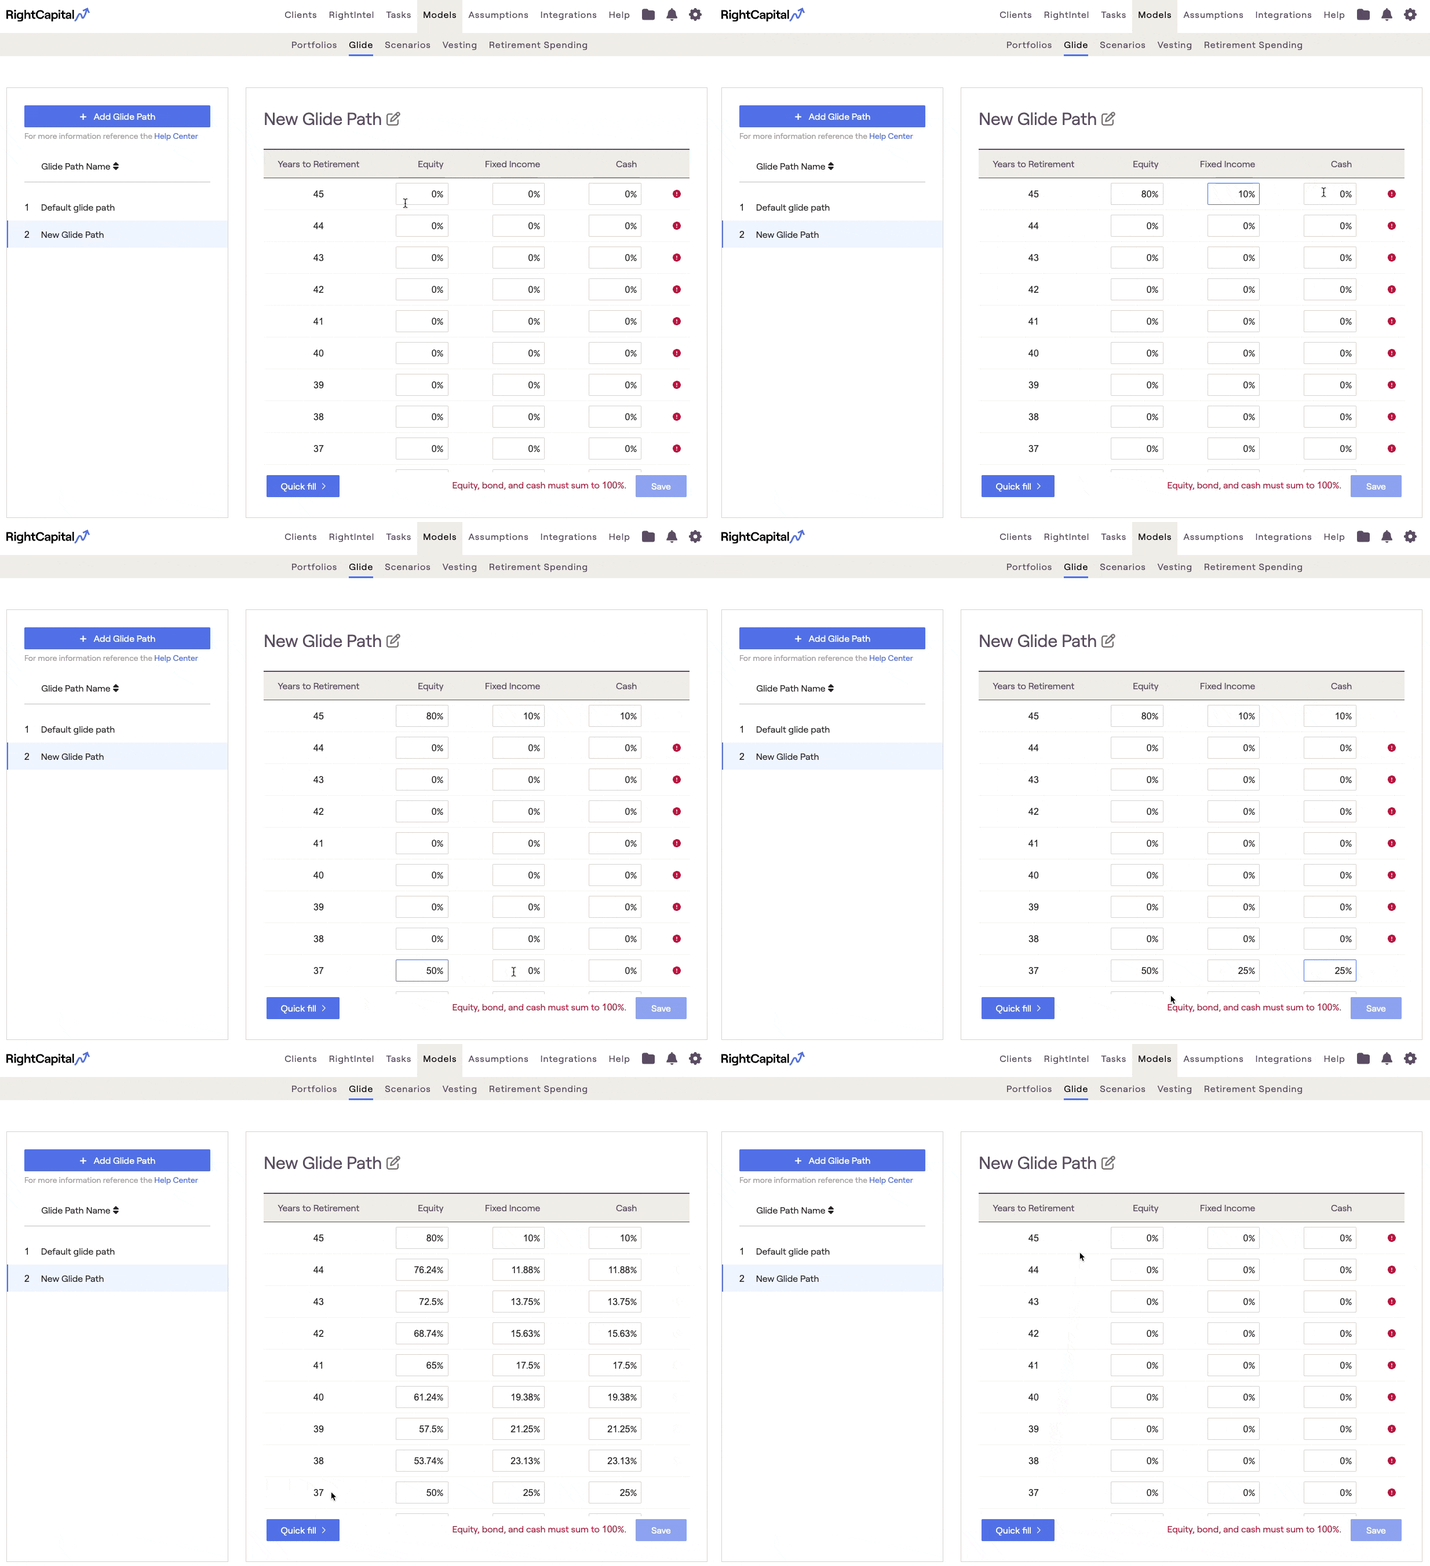
When creating a custom glide path, the Quick Fill button allows advisors to populate or clear information much more easily.
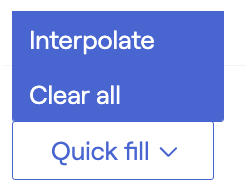
- Interpolate will automatically populate all 0% inputs between beginning and ending values listed. This feature saves time and helps to populate values more quickly.
- Clear all will reset all glide path inputs to 0%.
Re-order Glide Paths
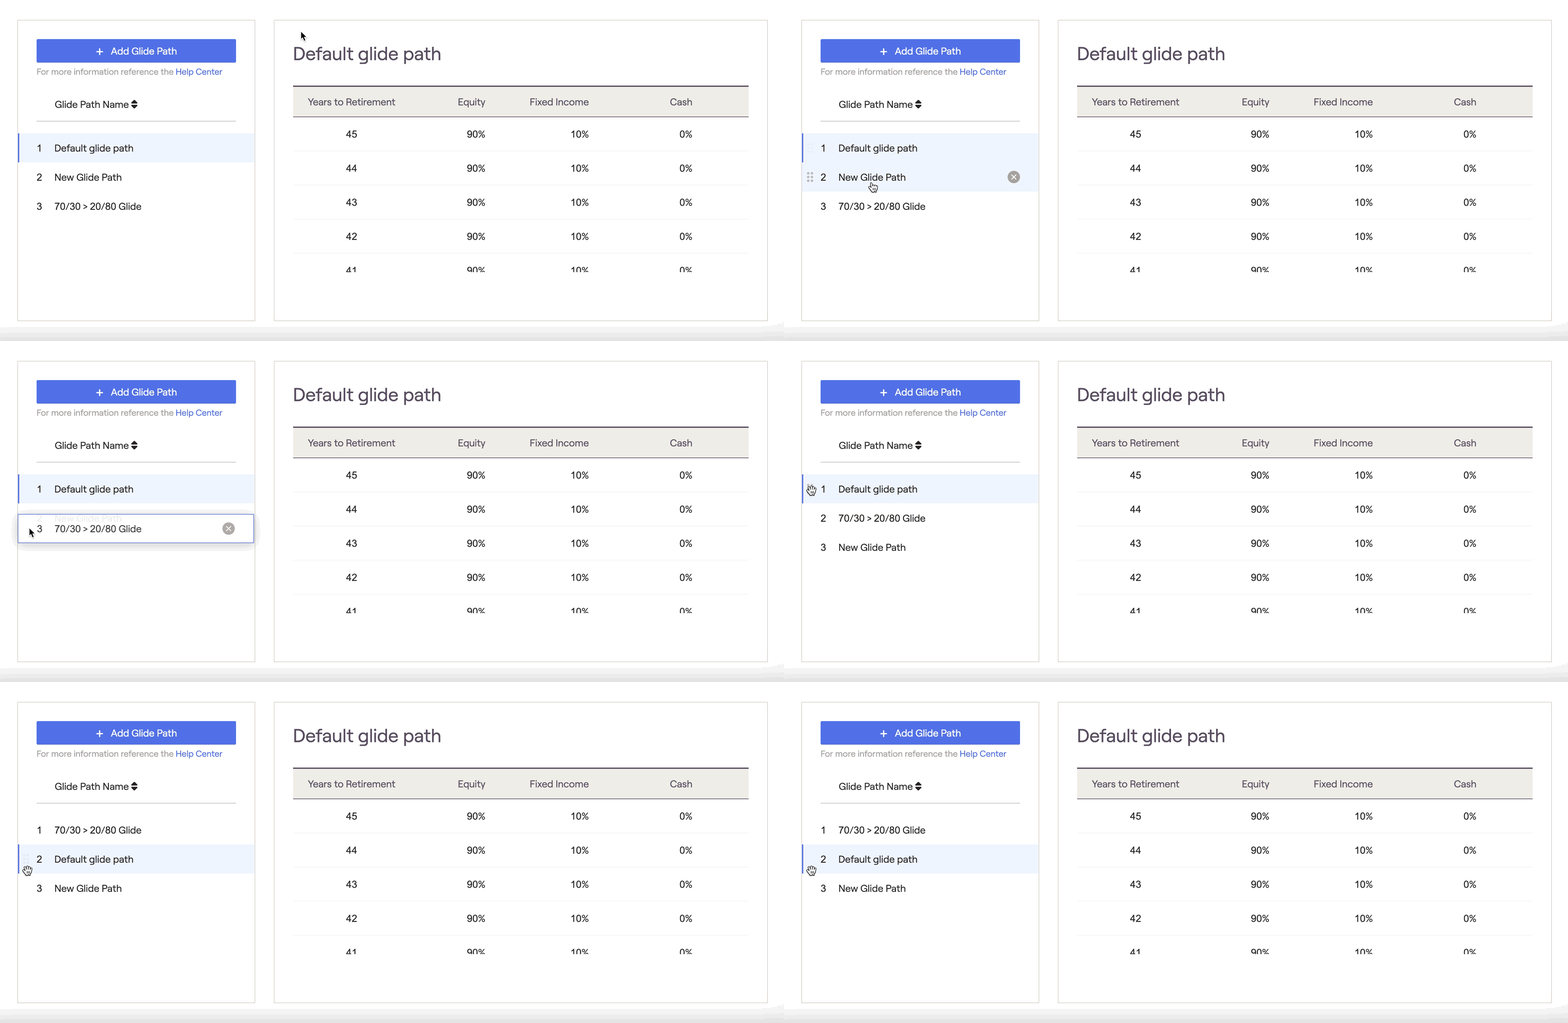
When viewing the list of your glide paths, RightCapital allows you to change the order they are displayed. Within the list of glide paths on the left, you can click on the title of one of the glide paths and then drag it to the desired location.
Delete Glide Paths
Custom glide paths can be deleted by hovering your mouse over a particular glide path, and then clicking the 'x' icon that appears to the right:

Where to Apply Glide Paths
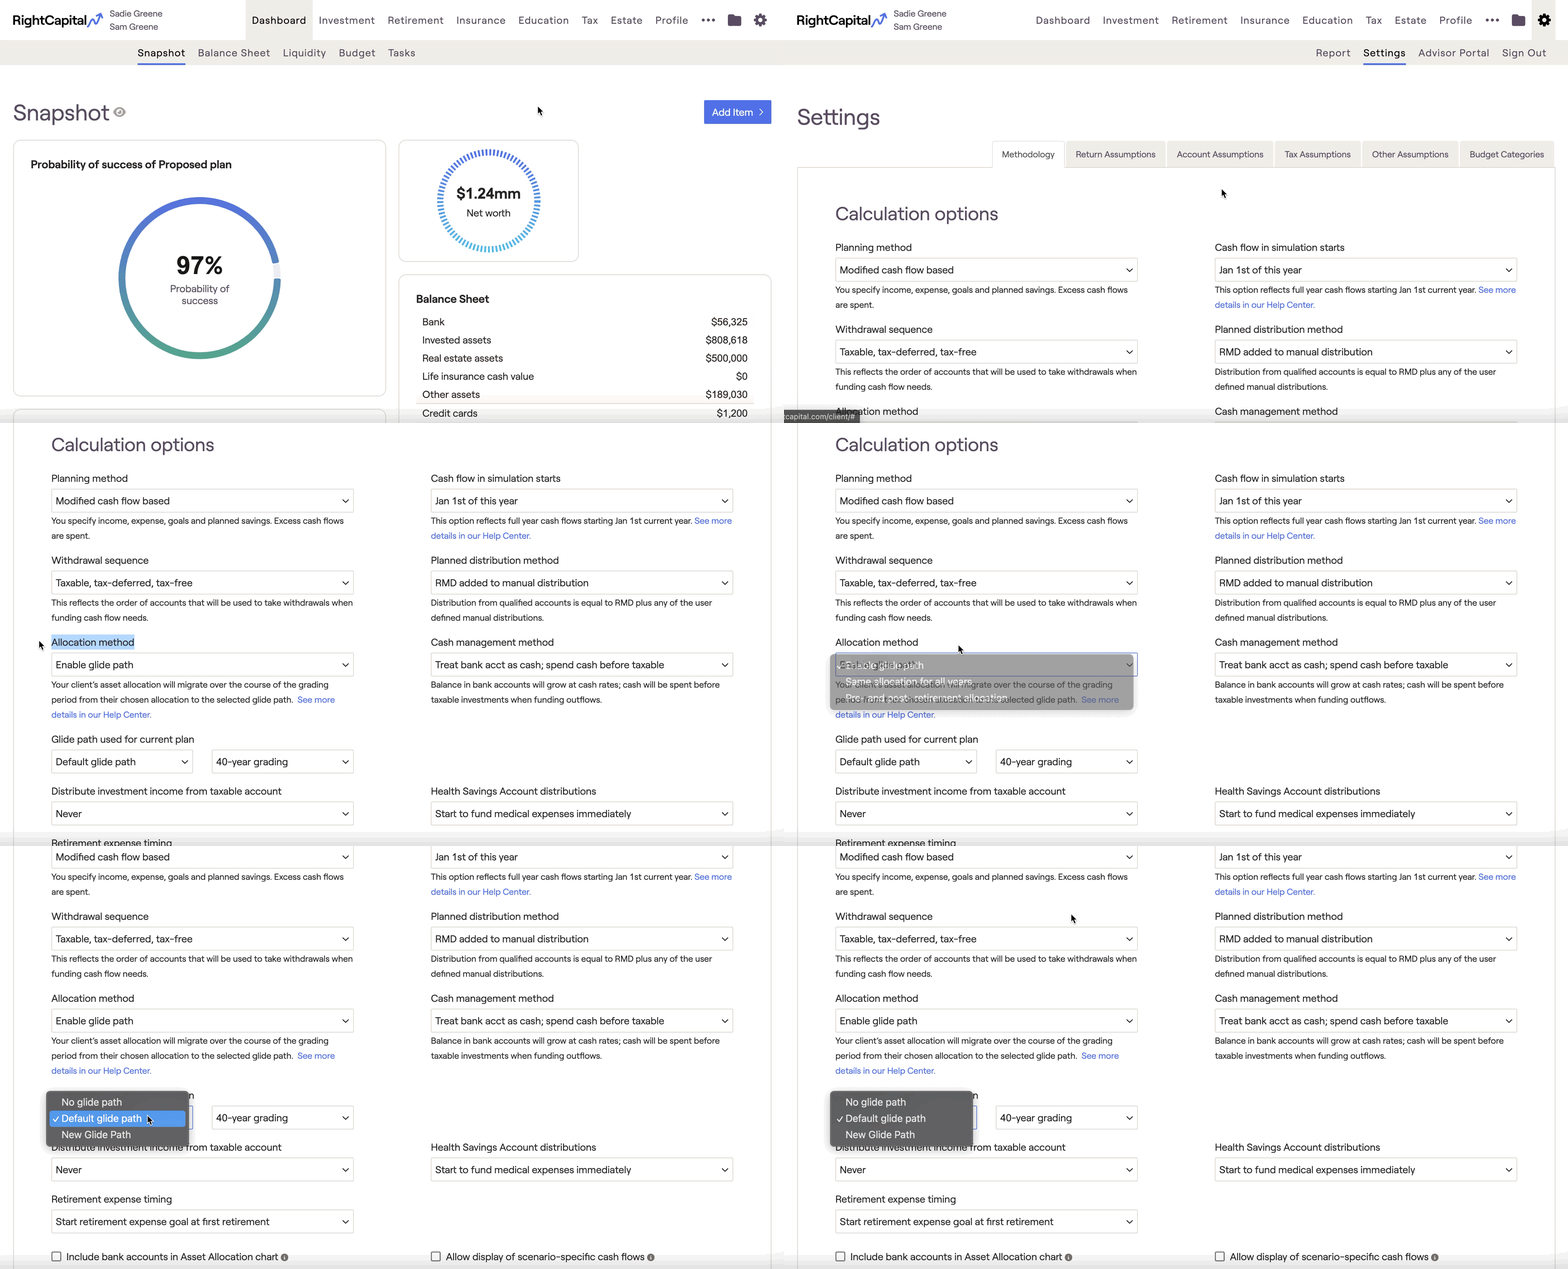
With a glide path enabled, the client's investment allocation will slowly migrate to the glide path allocation over the specified number of years. A second dropdown menu will then appear under the allocation method to determine which glide path will be used. Options will include the Default glide path, in addition to your own custom glide paths.

If '1-year grading' is selected, the client's allocation will automatically shift to the glide path allocation in year 2 of the projection. For any other grading schedule, the client's allocation will shift proportionally over the duration of the grading schedule, from the current allocation to the glide path allocation indicated.
If the grading schedule is 10 years, in year 2 of the projection, the allocation will be 9/10 of their selected allocation and 1/10 of the glide path allocation; after 10 years the allocation will be 100% glide path allocation.
