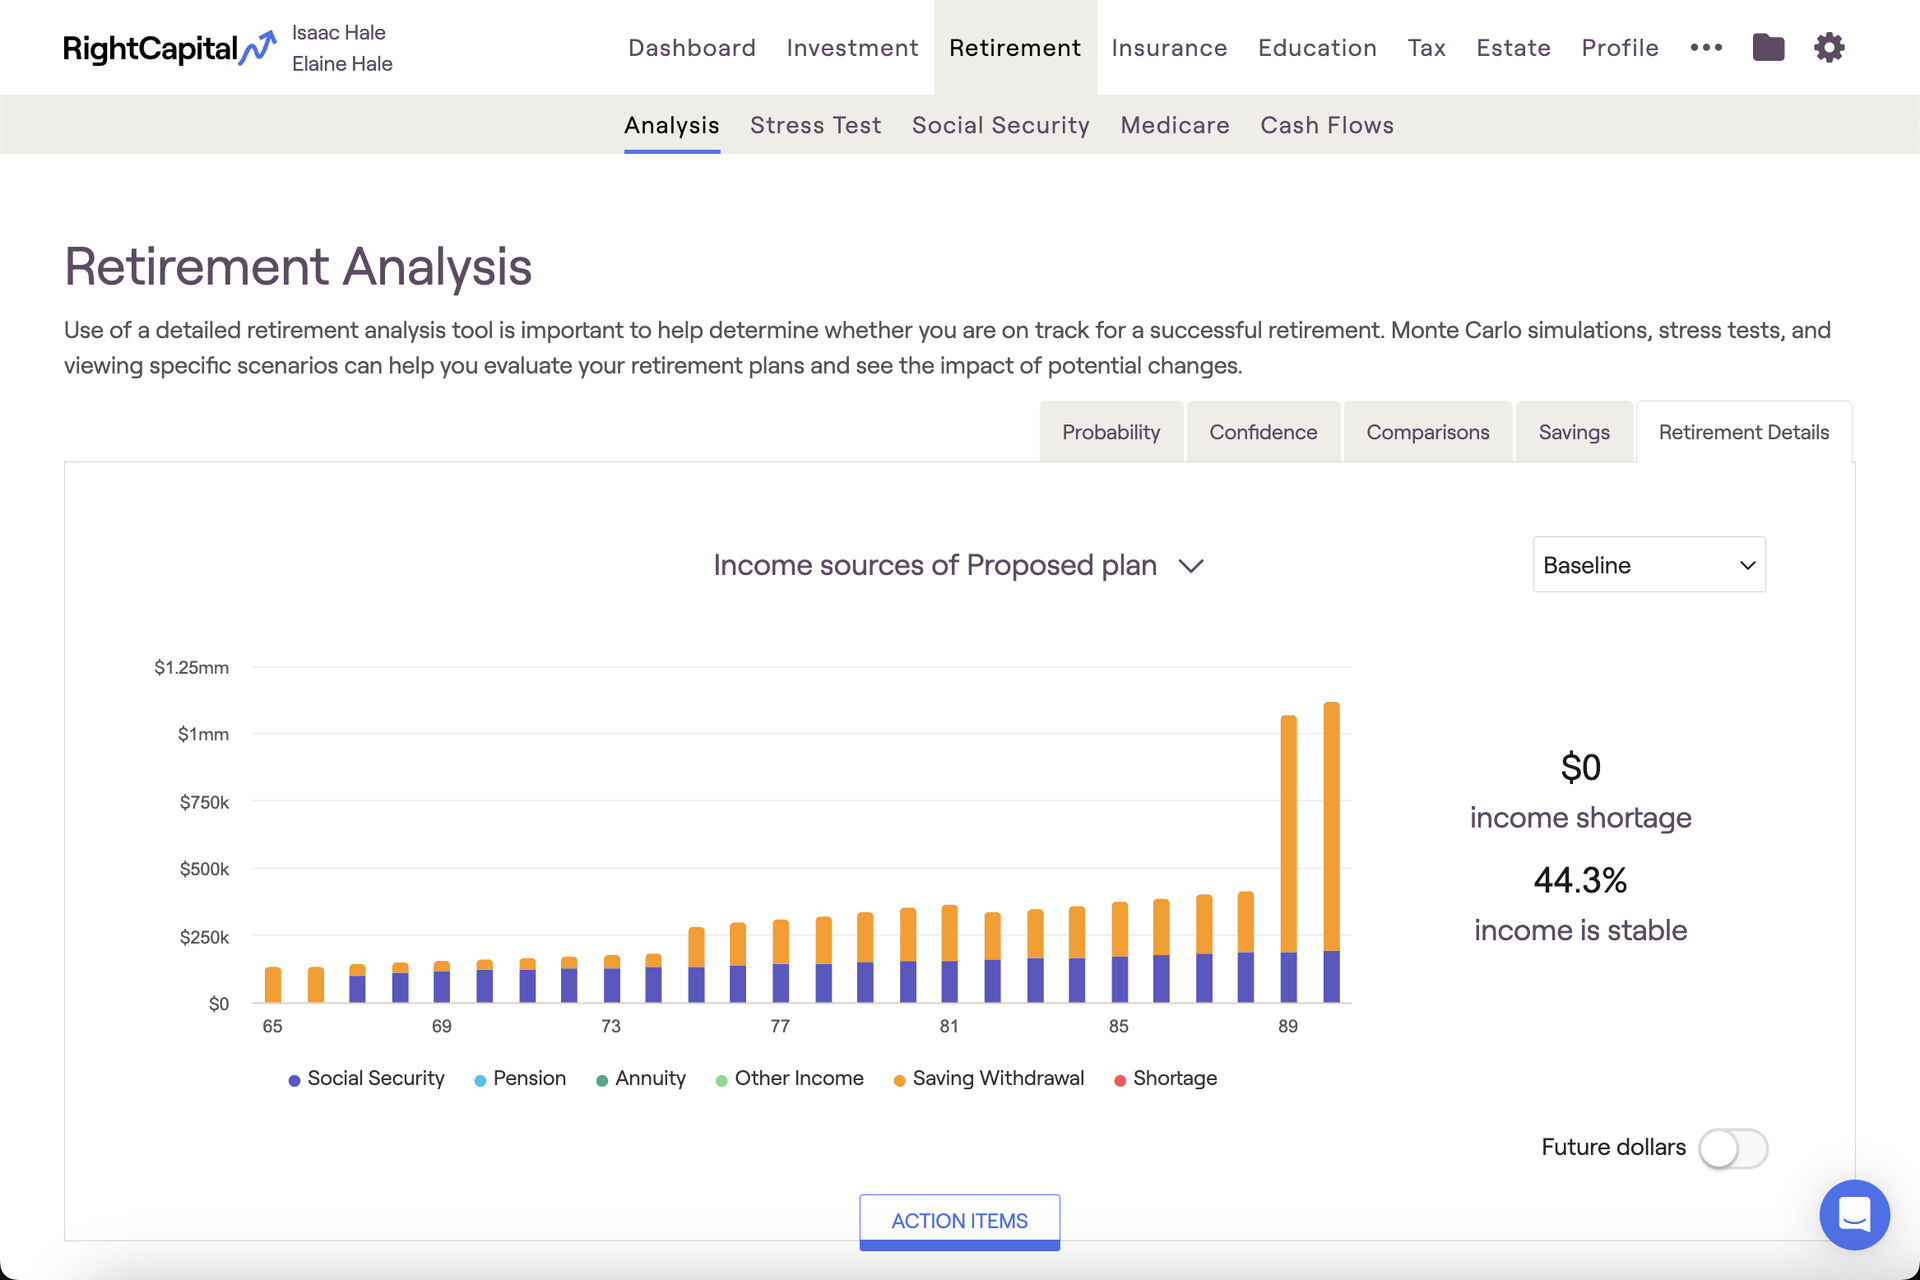
This tab offers three graphs that provide visual backdrops for crucial talking points: Income sources, Withdrawal rate, and Retirement spending. Hovering your mouse over each chart allows you to see dollar values for each year:
Just like the Comparisons tab, Retirement Details allows you to toggle between different return scenarios using the dropdown menu in the upper right.
Income Sources
The Income Sources chart provides a breakdown of the client's retirement income sources. Each income source is color-coded to provide a clear, visual distinction between each:
Social Security, Pension Income, Annuity Income, and Savings Withdrawals are always shown, even when not required to cover a client's yearly outflows. Other income represents the combined amount of all other income sources, and will only display in this chart if needed to cover additional outflows.
Withdrawal Rate
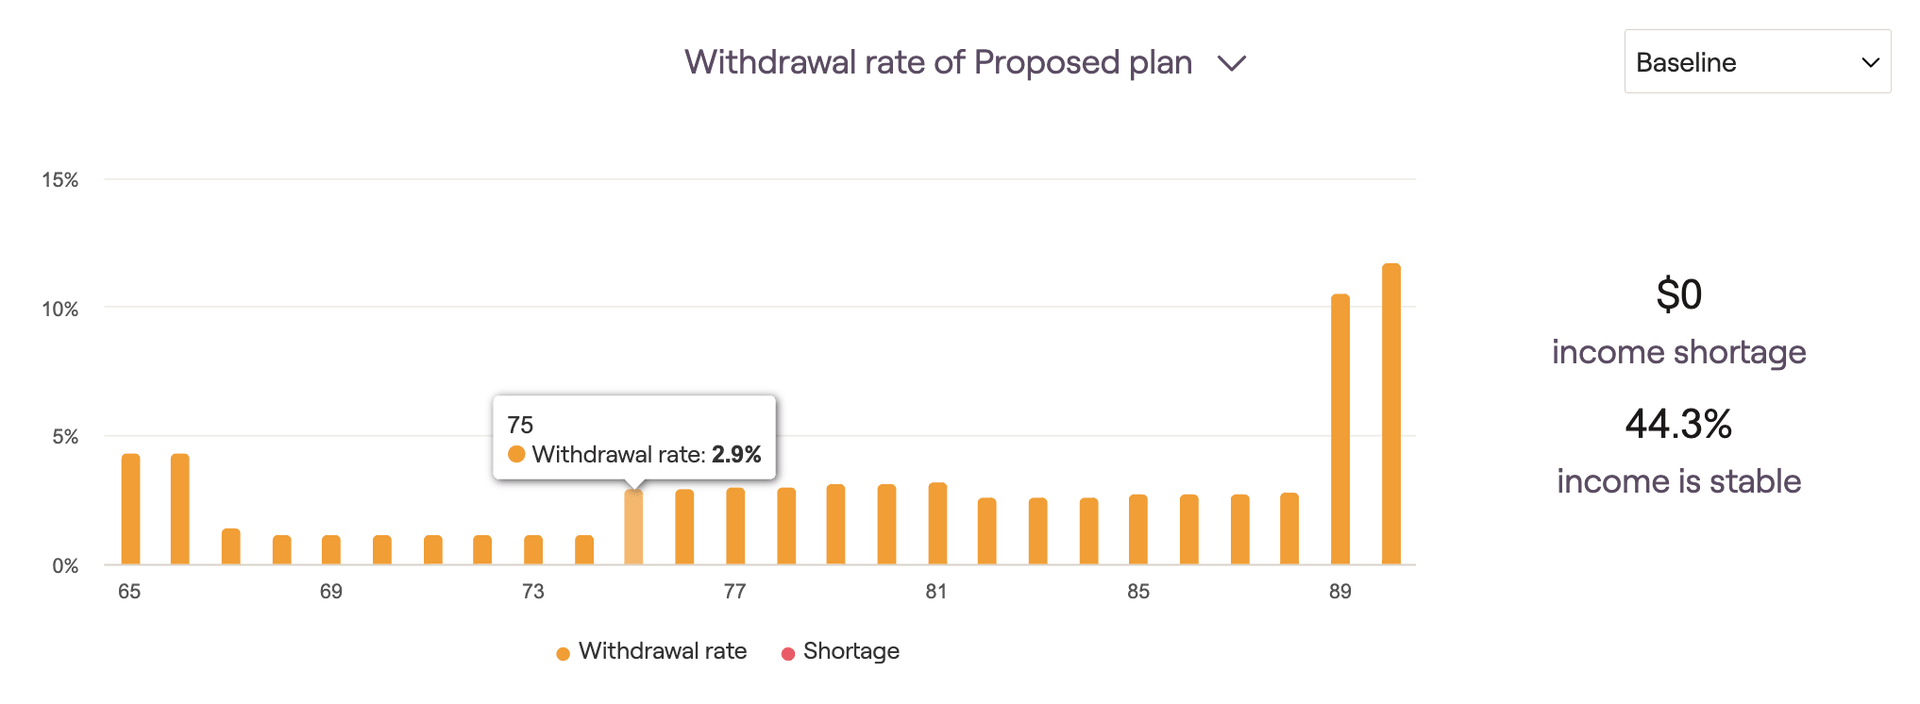
The Withdrawal rate chart illustrates the percentage of invested assets withdrawn each year to fund retirement expenses. This number will include any RMDs, manual distributions, and negative net flows that occur due to cash flow deficits. Hover your mouse over the bar chart to see the withdrawal rate percentages for each year.
Retirement Spending
The Retirement Spending chart provides a breakdown of the client's retirement expenses. Each expense category is color-coded to provide a clear, visual distinction between each:
This chart excels at visualizing the impact of retirement spending strategies on a client's retirement expenses. Implement a spending strategy using the Action Items, and then isolate the "retirement expense" category using the legend underneath the chart:
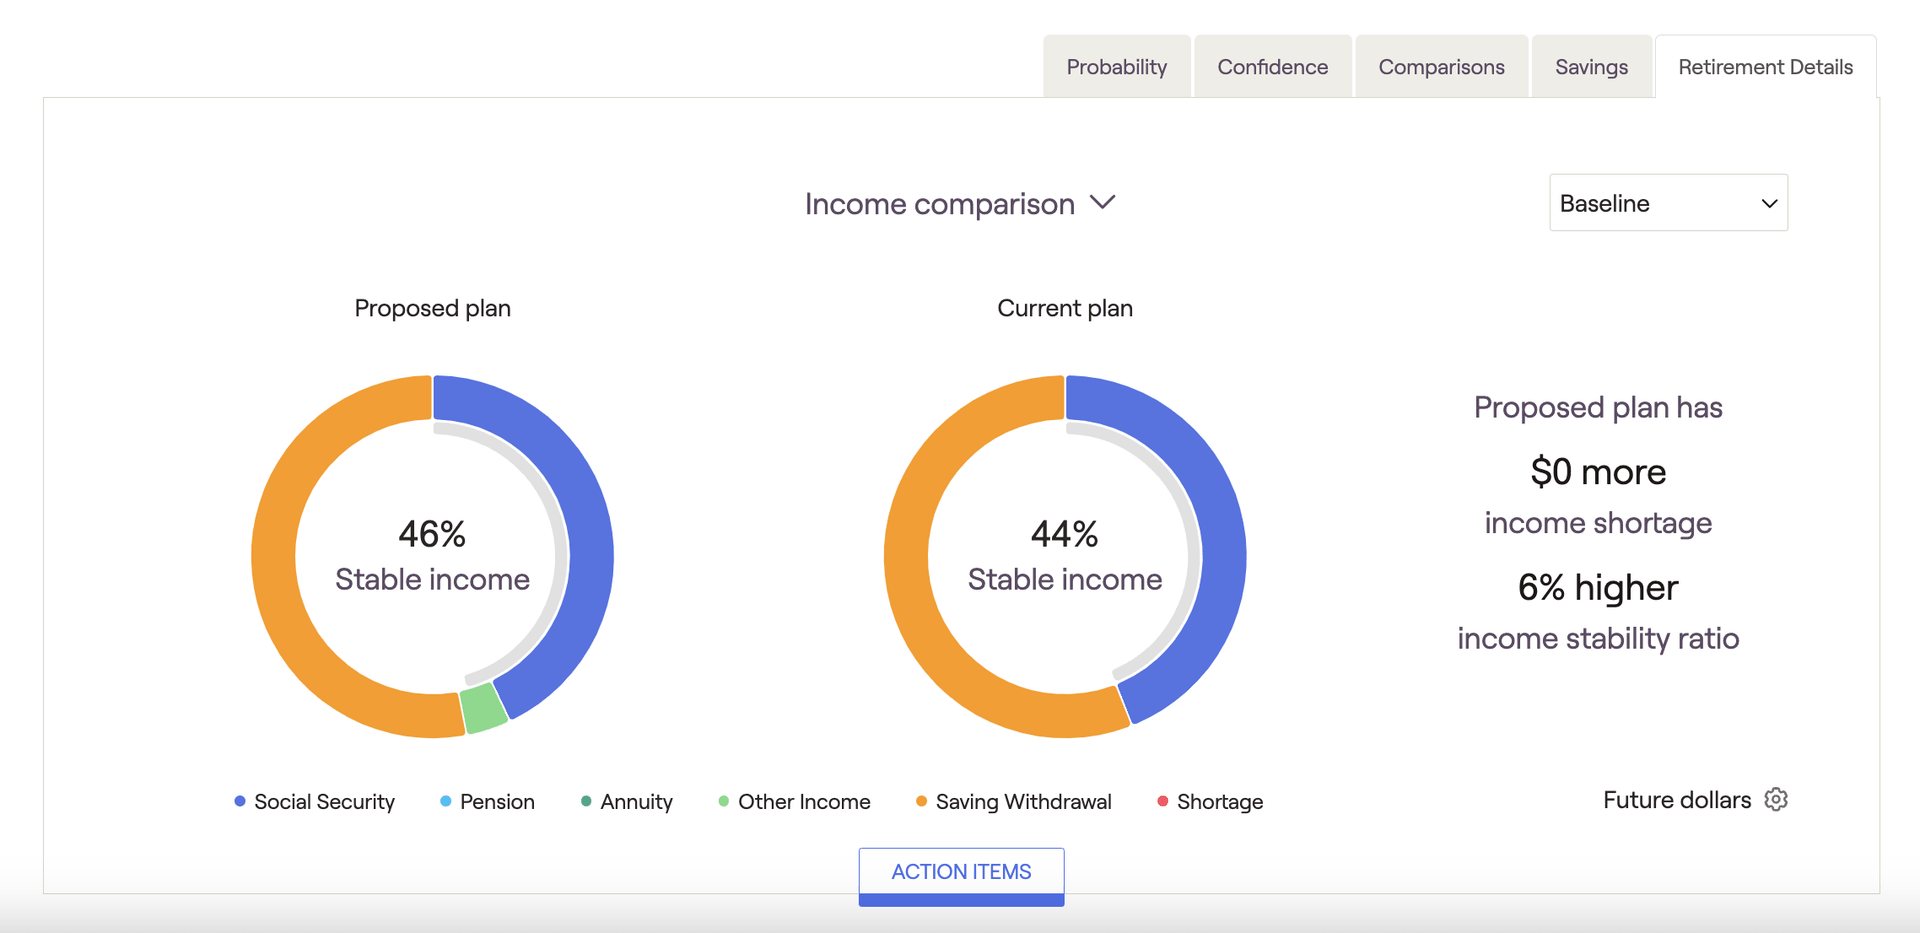
Income Comparison
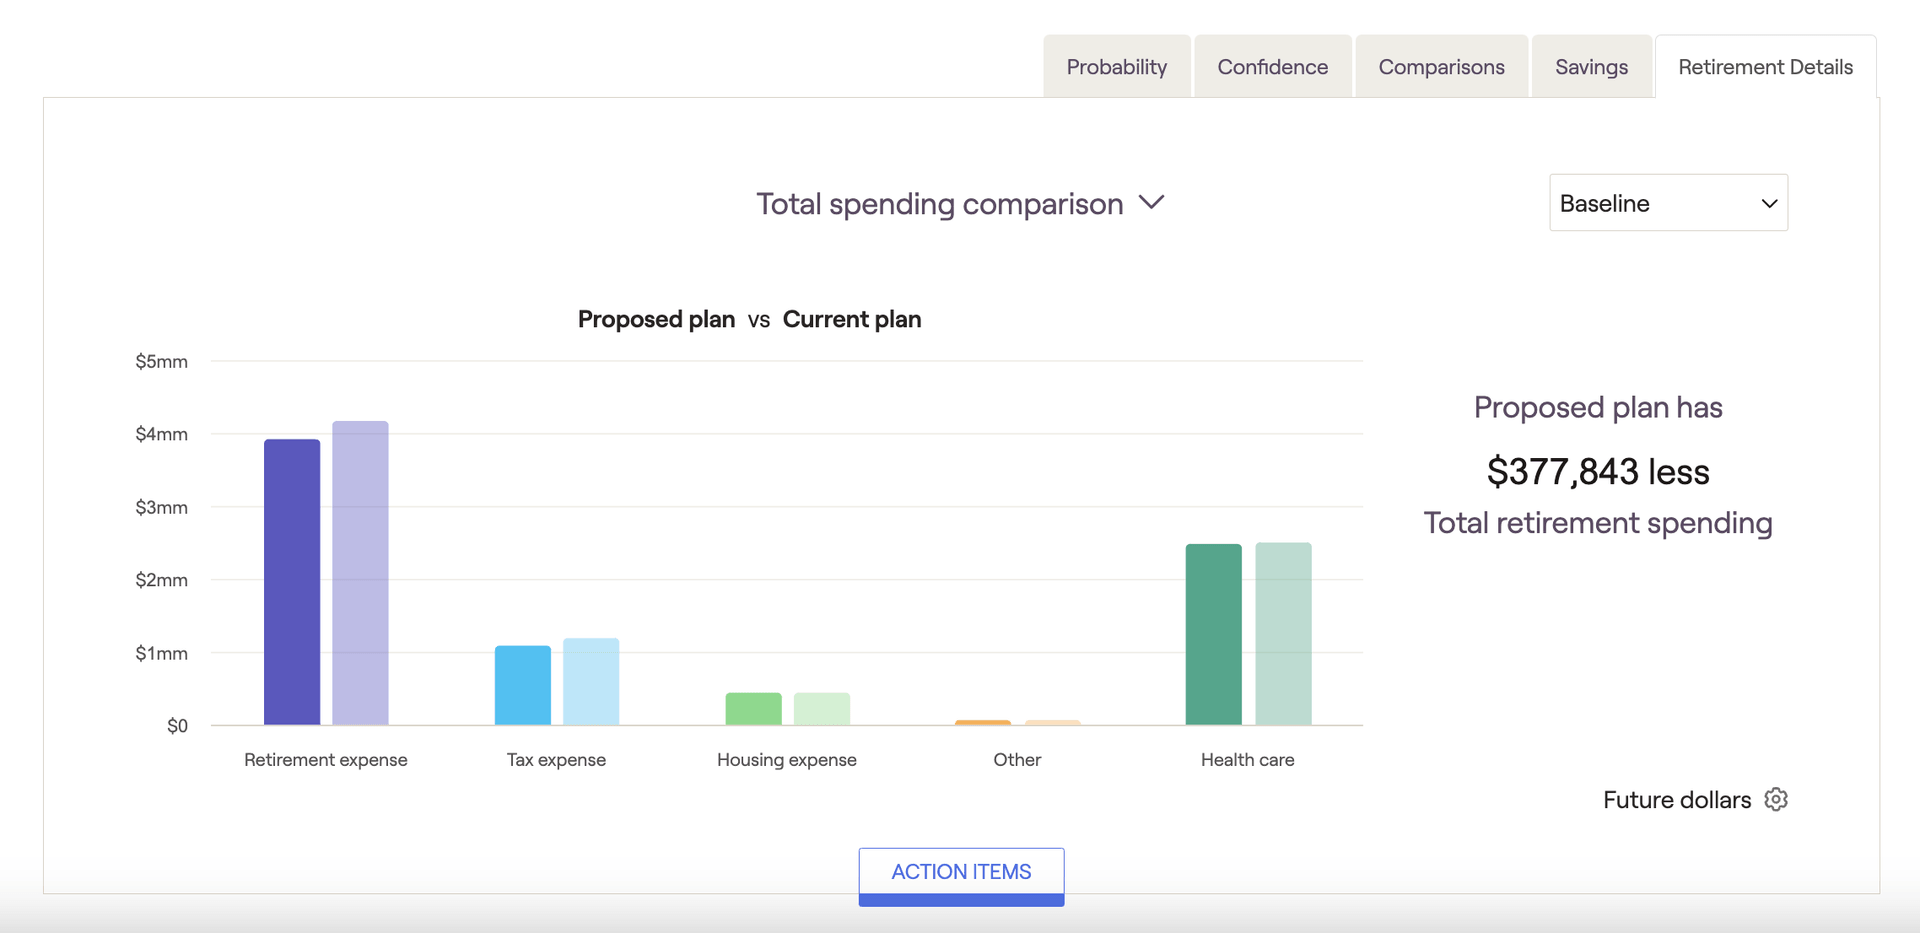
Total Spending Comparison
Floor and Ceiling Strategy
If your currently selected proposal is utilizing the 'Floor and Ceiling' retirement spending strategy, you'll find an additional chart called Floor and Ceiling Spending Strategy:

This chart helps to visualize a client's annual retirement expenses in relation to the floor and ceiling values. As a reminder, you can update the parameters for the Floor and Ceiling strategy in the Advisor Portal > Models > Retirement Spending tab.
Guardrails Strategy
If your currently selected proposal is utilizing the 'Guardrails' retirement spending strategy, you'll find an additional chart called Guardrails Spending Strategy:
This chart displays a client's withdrawal rates in retirement, side-by-side with their retirement living expenses. This comparison makes it clear how a client's expenses are impacted when their withdrawal rate exceeds or dips below the upper and lower guardrails. As a reminder, you can update the parameters for the Guardrails strategy in the Advisor Portal > Models > Retirement Spending tab.
Using the display settings menu to the lower right of the chart, you can choose to swap client age with calendar year on the x-axis of the chart(s):


