Tax-efficient investing and tax-smart withdrawals are two crucial components of any successful retirement plan. With RightCapital's Tax Strategies module, you can quickly identify which tax strategies will provide the most value for your clients, and clearly demonstrate that value with intuitive, engaging visuals.
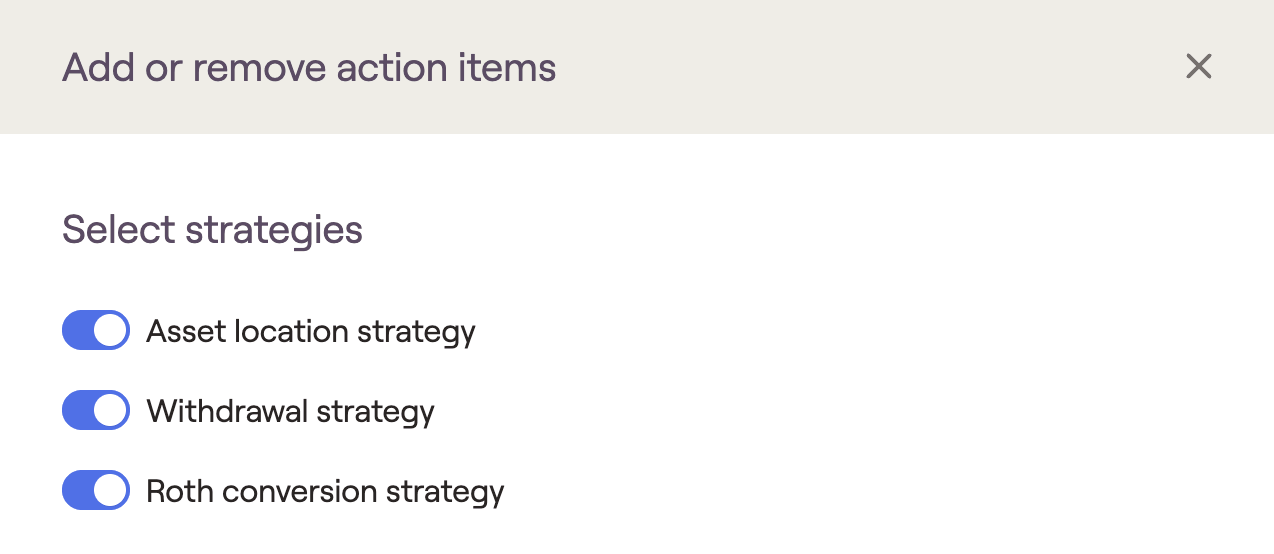
- Use the Action Items to model Roth conversions, shift a client's Asset location, and alter their Withdrawal sequence.
Utilize key visuals within the Summary, Calibration, and Comparison tabs to showcase the value of your tailored recommendations.
Reference the Details tab for granular cash flow details such as Roth conversion amounts, medicare premium adjustments, and other tax details.
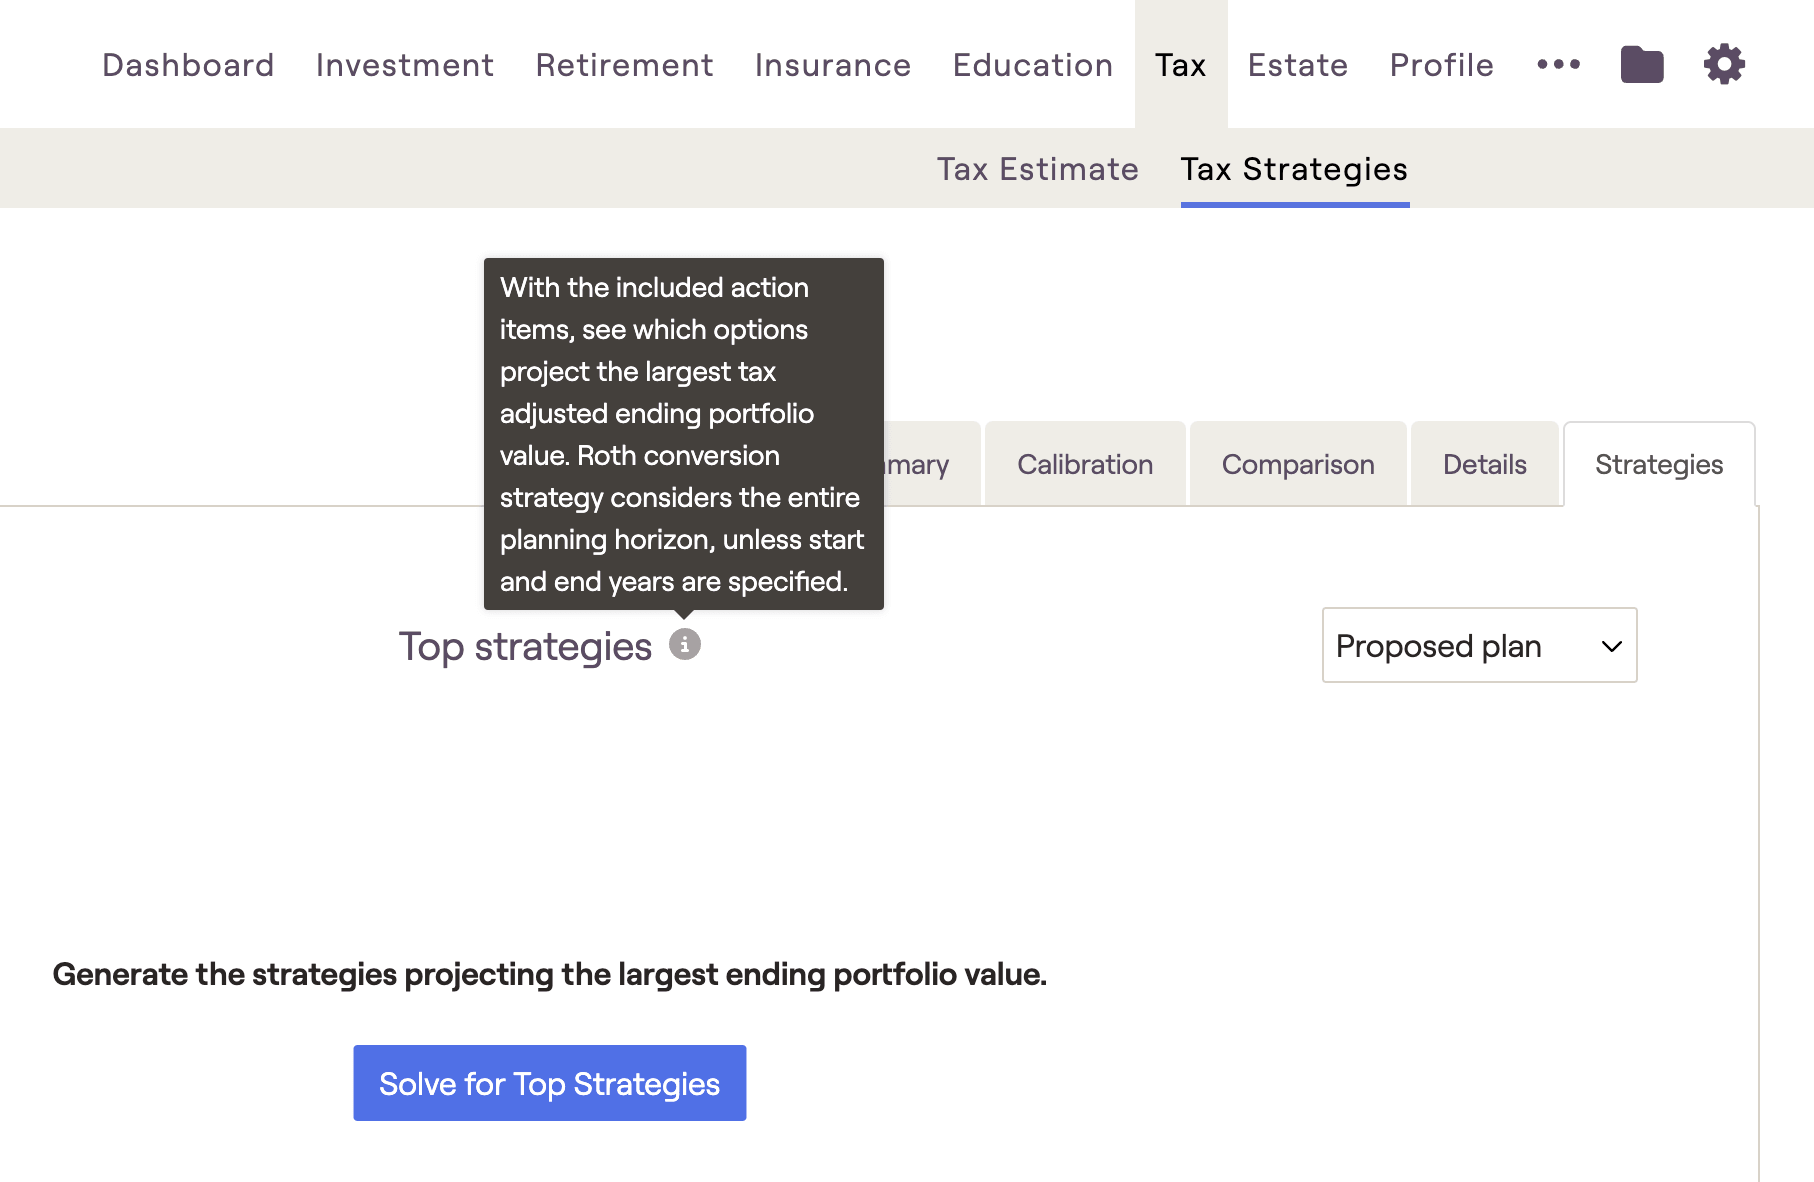
Visit the Strategies tab to solve for the top five tax strategy combinations with the push of a button.
Import your recommendations into the client's retirement proposal, via the Tax Strategy action item in the Retirement Analysis module.
If you'd prefer a hands-on, visual overview of the Tax Strategies module, click the link below to watch our dedicated Expenses training video:
Action Items

Asset Location Strategy
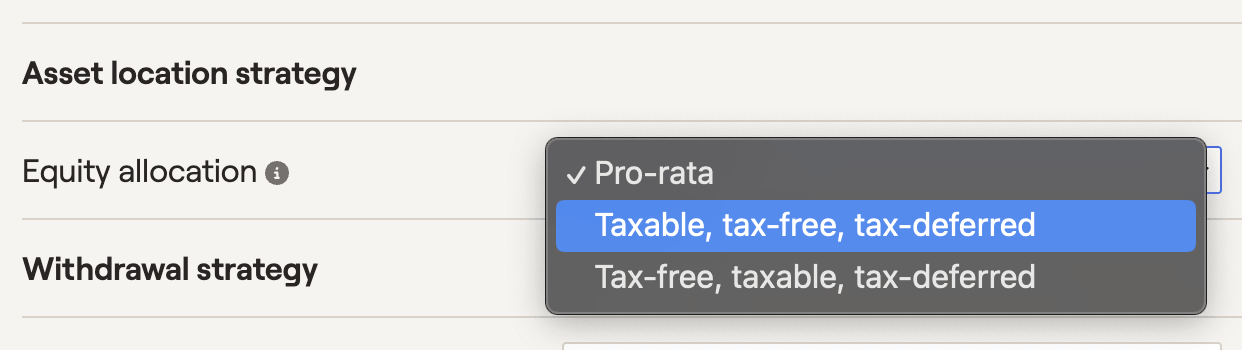
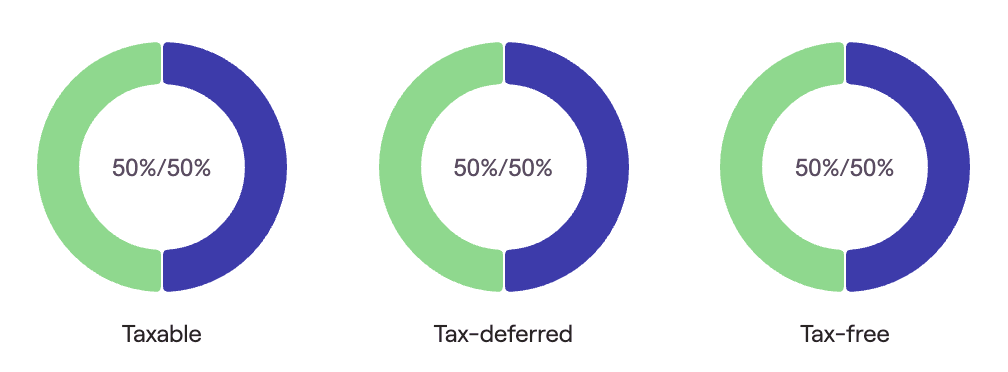
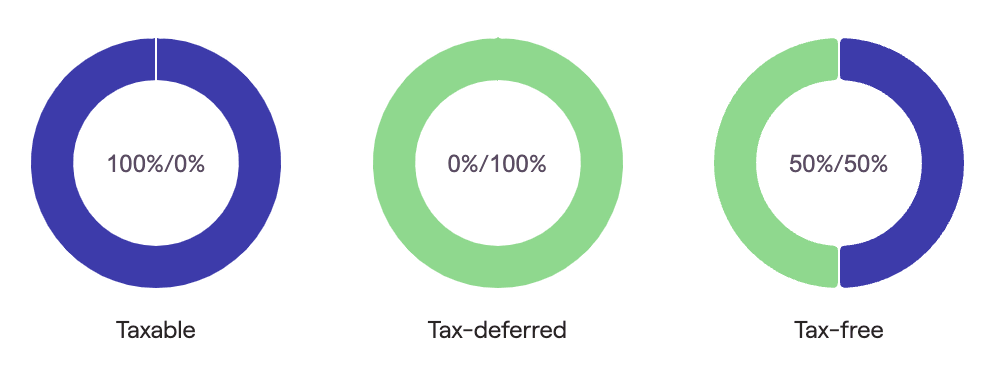
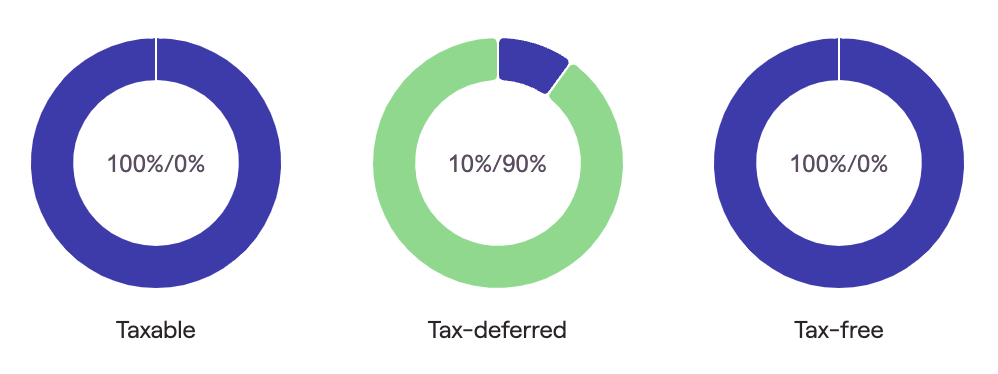
Generally speaking, clients that currently fall into high marginal tax brackets (and/or clients that expect to be in lower tax brackets in the future) may benefit from an asset location strategy. However, this is highly plan-dependent! Use the Tax Strategies module to identify if an asset location strategy fits each client well.
Withdrawal Strategy

Changes in withdrawal sequence can be best visualized using the various charts in the Summary and Comparison tabs. By making all other variables the same, you can directly compare two different withdrawal sequences between the Proposed and Reference strategies. You can also mix and match different withdrawal sequences with other tax strategies:

Conversion/Distribution Strategy
Choose between:
- Convert to Roth: Convert available funds to a Roth IRA.
- Convert to Roth with Withholding: Convert available funds while withholding funds for taxes.
- Normal Distribution: Distribute funds with no conversion.
Choose between:
Ordinary income tax brackets
Capital gains tax brackets
- Medicare premium tax brackets for IRMAA adjustments
After selecting a target, use the 'Fill up the tax bracket' slider to choose a specific bracket threshold. RightCapital will then convert/distribute as much as possible without exceeding the specified bracket. Please note that these are the upper thresholds of each bracket (hence no 37% bracket for ordinary income, or 20% for capital gains):

By default, conversions/distributions will occur throughout the duration of the client plan ('Already Started' through 'End of Both Plans'). To dial in a more specific time frame, click the Edit button in the lower right of the Action Items, and check the boxes for 'Conversions/distributions start' and/or 'Conversions/distributions end':

Some advisors will start conversions right after clients stop working, and end them right before RMDs begin within the projections. This is a popular strategy that works well for many clients!
401(k)
IRA
Pension
Annuity

After fine-tuning your Roth conversion strategy in the Calibration tab, the Comparison tab is a great place to showcase the value of your conversion strategy in terms of overall invested assets, total taxes paid, and tax-adjusted ending wealth. The exact conversion amounts for each year can be found within the Details tab:
Estimated Terminal Tax Rate

Please note that the estimated terminal tax rate will only impact the values displayed within the Tax Strategies tab. This slider will not have an impact on other areas of the software, including the Retirement Analysis when importing a tax strategy proposal (put differently, the Retirement Analysis reflects a 0% terminal tax rate).
Summary Tab
The Summary tab of the Tax Strategies module serves as your home base, highlighting the most important differences between your proposed and reference strategies.
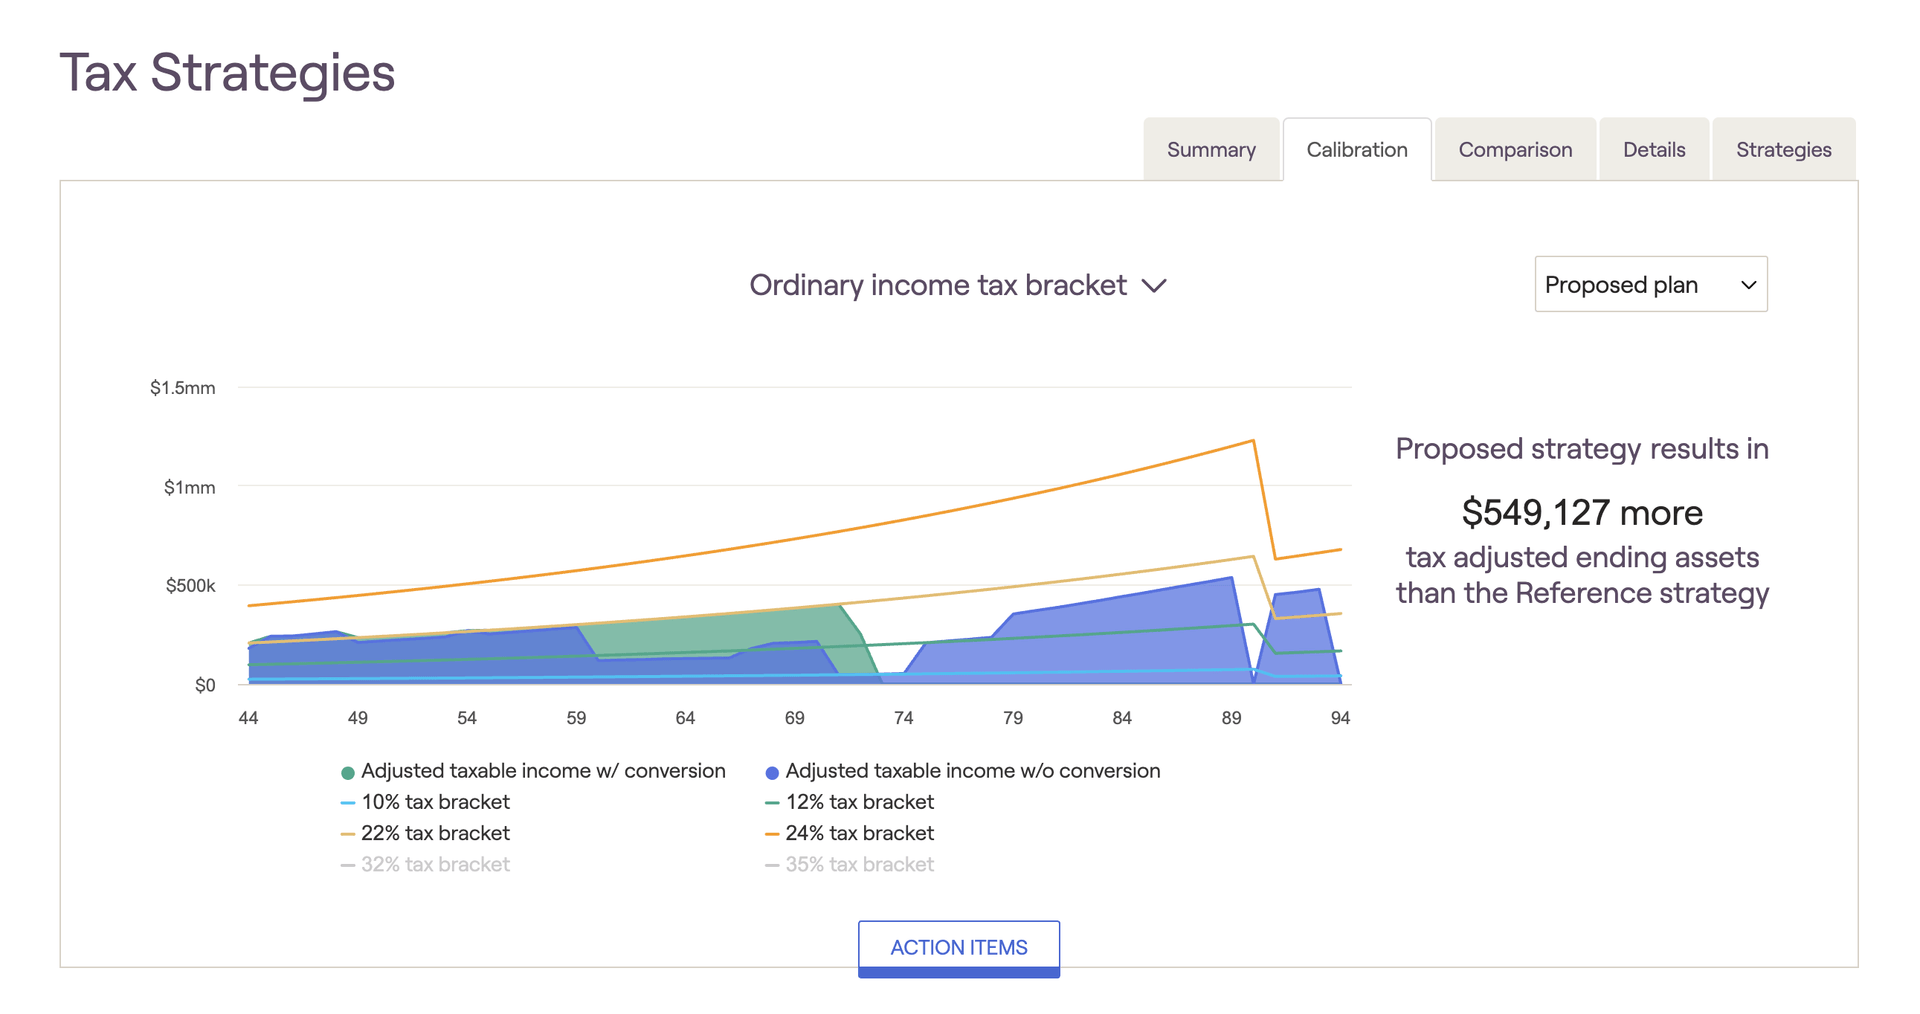
Calibration Tab
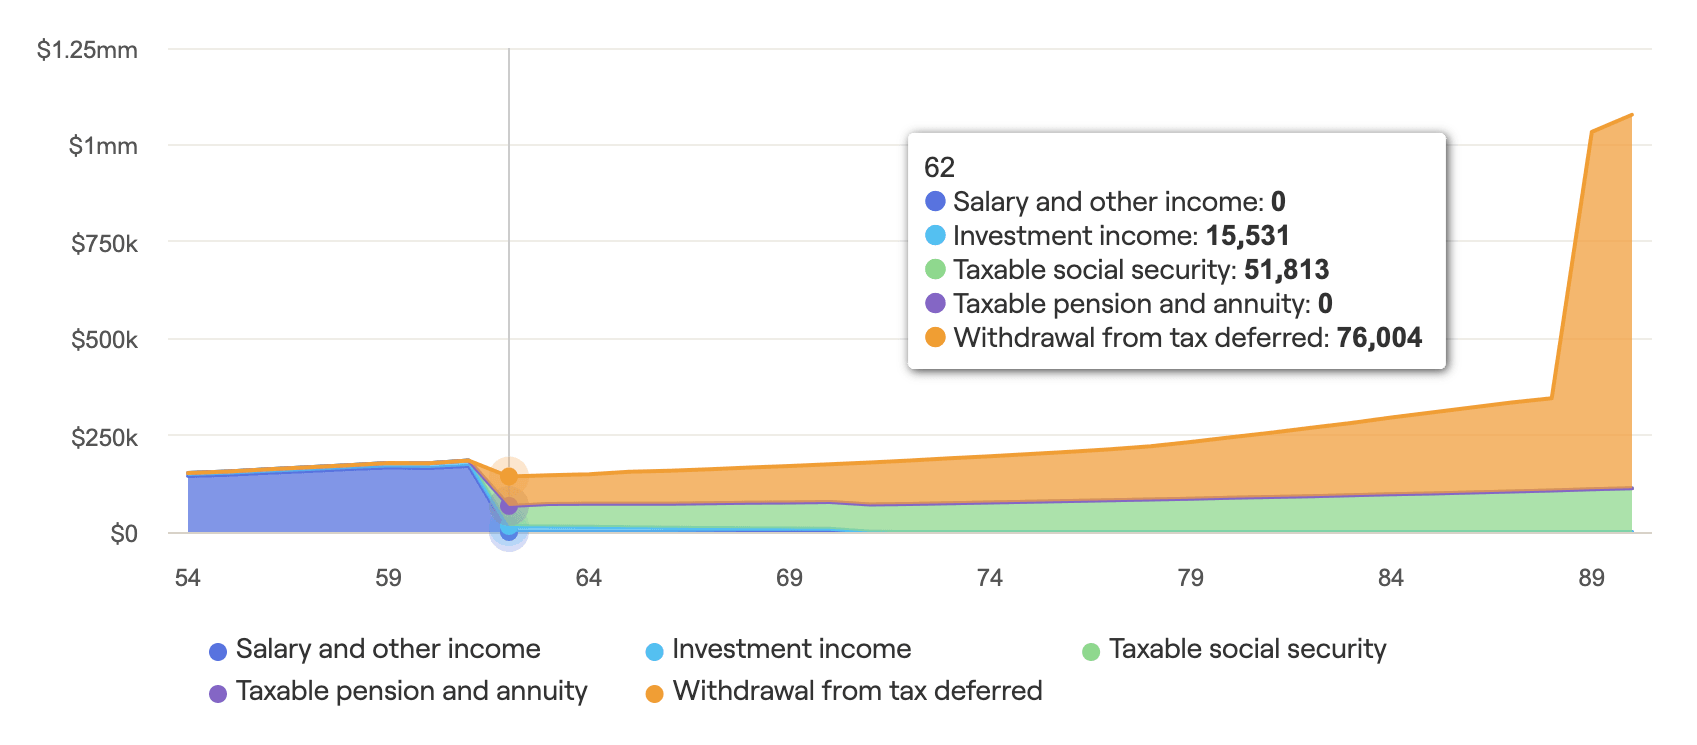
The Calibration screen provides insight into where clients fall in relation to various tax bracket thresholds. Federal income tax brackets, capital gains brackets, and IRMAA brackets for Medicare premium adjustments can all be viewed via the dropdown menu above the graph. You will also find the key tax components that make up the client's taxable income during each year of the financial plan:
Tax bracket thresholds will increase each year based on your Tax Inflation rate. You can use the legend beneath the chart to highlight, add, or remove items for visual clarity.
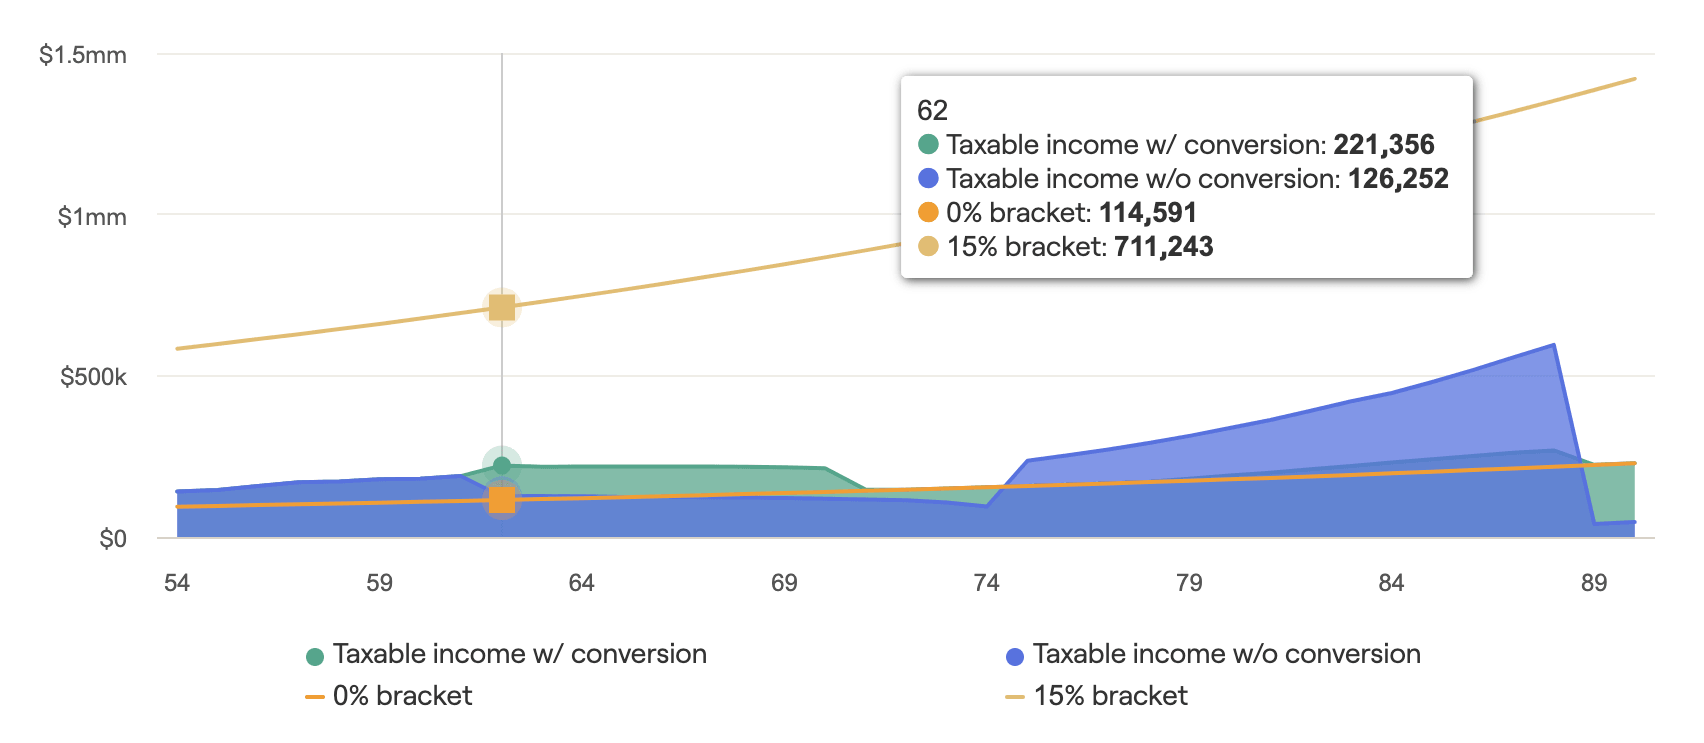
The Capital gains tax bracket graph shows the household’s total taxable income in relation to the capital gains bracket thresholds (0% and 15%). Capital gains income above the 15% bracket will be taxed at 20%.
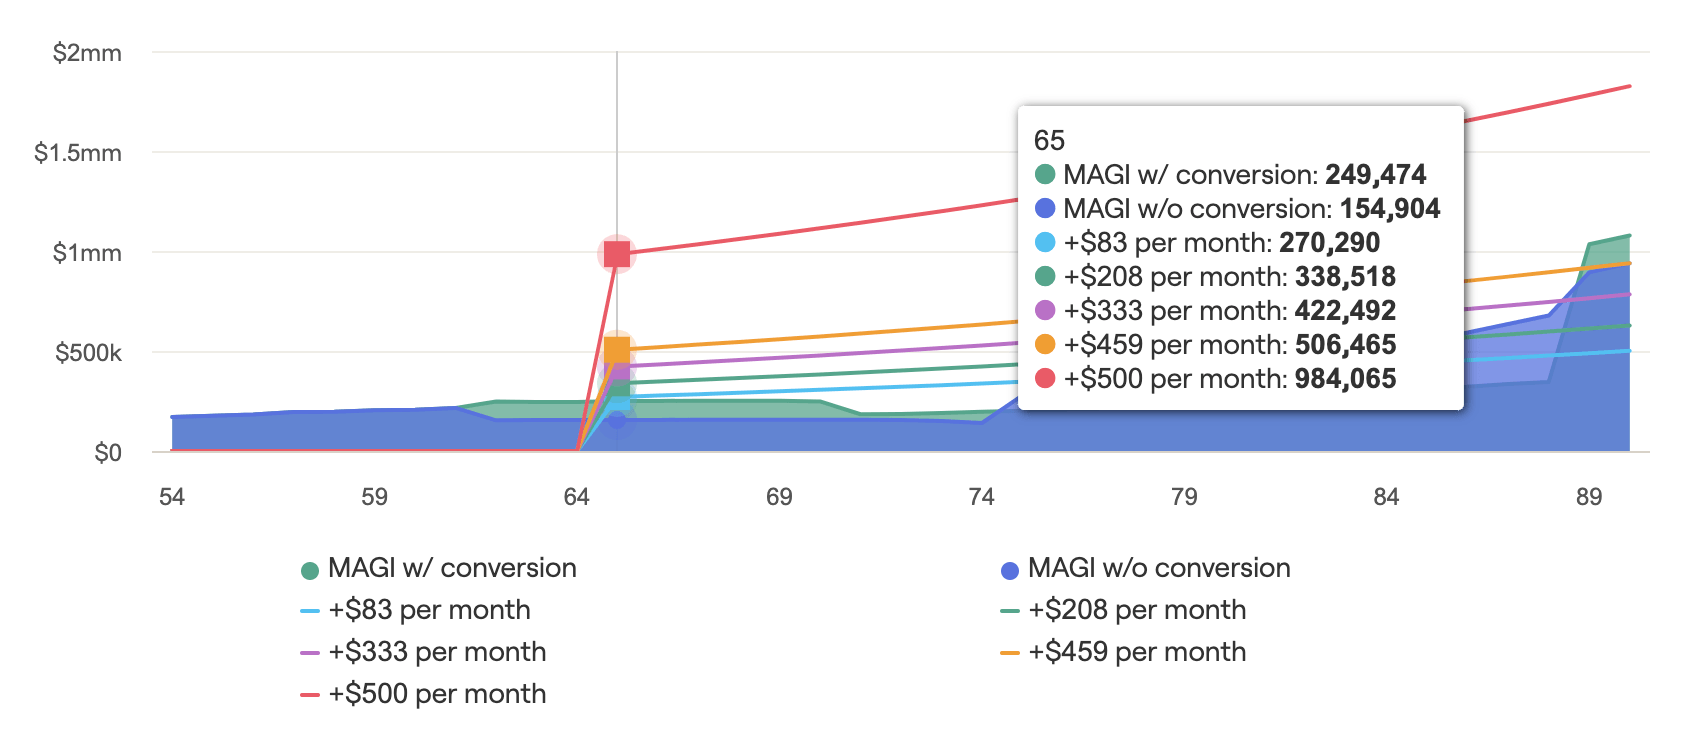
The Medicare premium tax bracket graph shows the household’s Modified Adjusted Gross Income (MAGI) in relation to the IRMAA thresholds that trigger higher Medicare premiums. The lines on the graph denote the monthly increase in the premium amount based on each MAGI threshold:
Comparison Tab
The Comparison tab is the best place to directly compare your proposed and reference tax strategies. There are six charts available here, comparing and contrasting various elements of each strategy to help clients better understand the value of your recommendations.
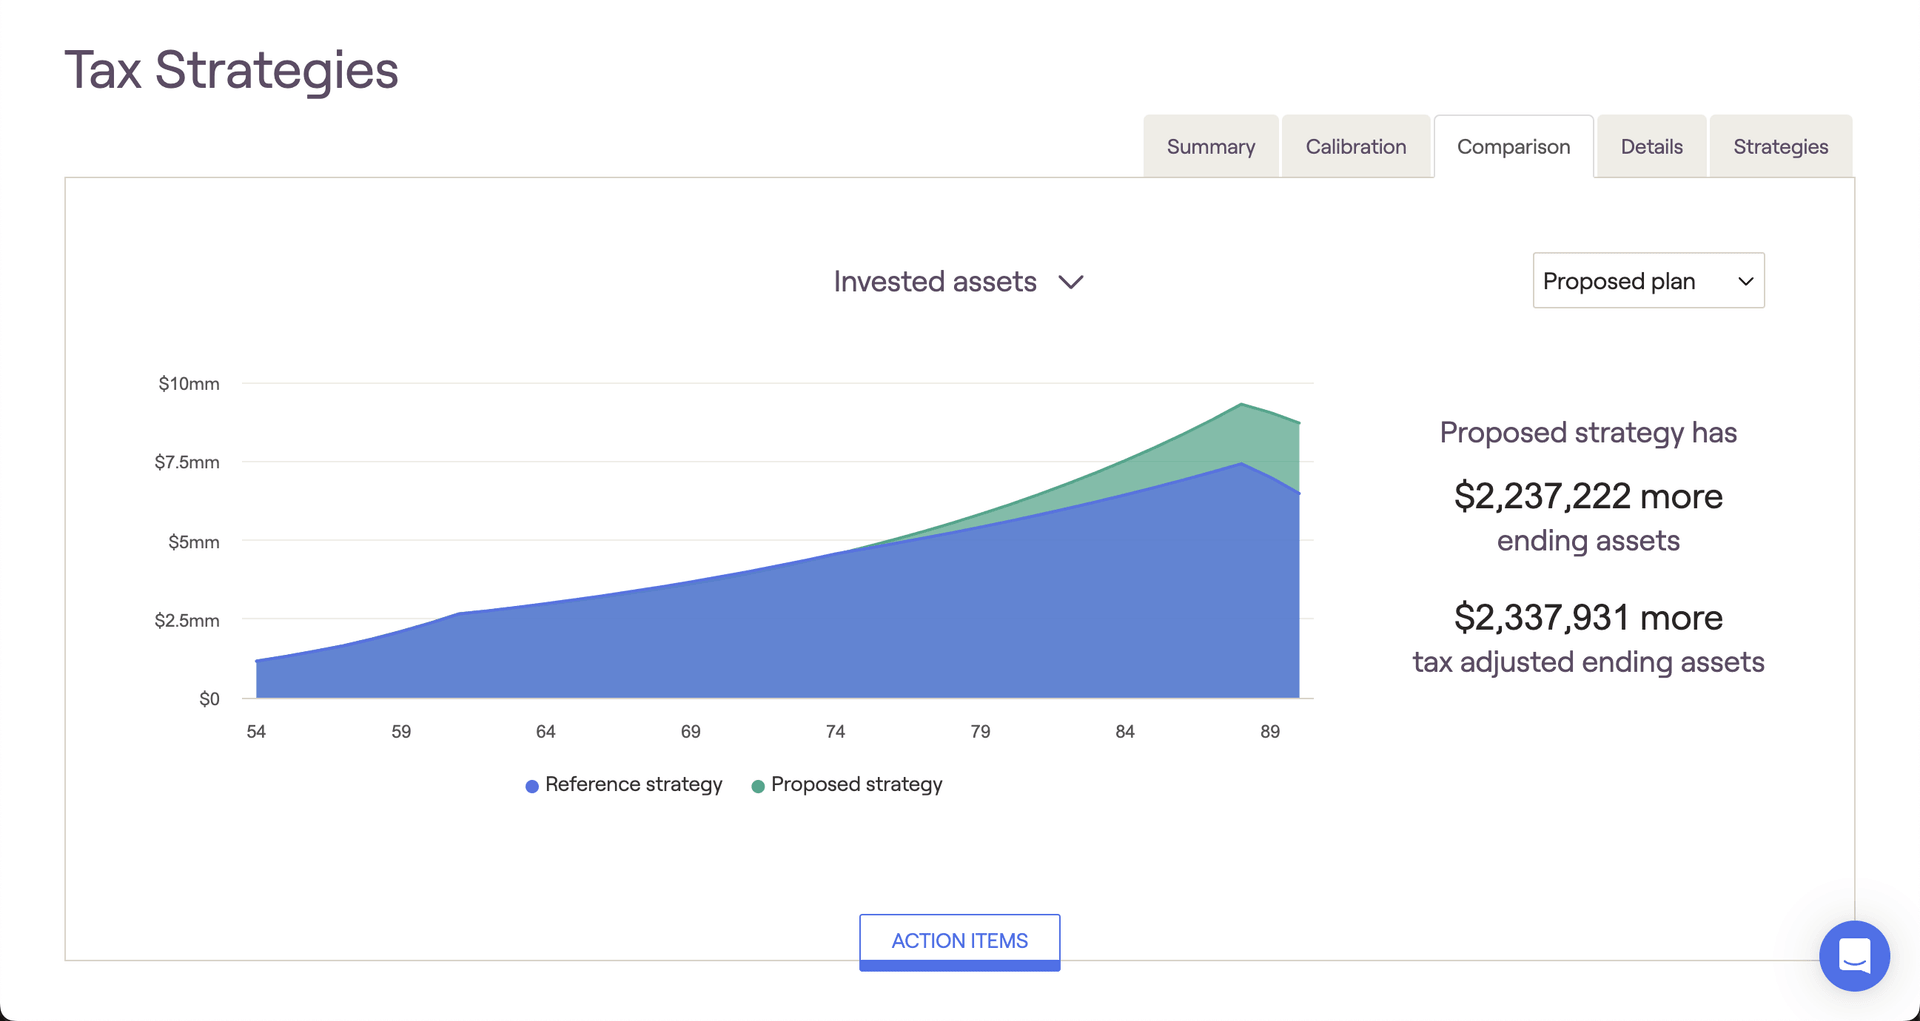
The Invested assets chart is borrowed from the Retirement Analysis module, comparing the value of invested assets over time (excluding real estate and other assets). To the right of the chart you will find two key metrics highlighting the difference between your proposed strategy and reference strategy. The "tax-adjusted" figure will factor in your estimated terminal tax rate, whereas the "ending assets" value will not. If your estimated terminal tax rate is set to 0%, these values will be the same:
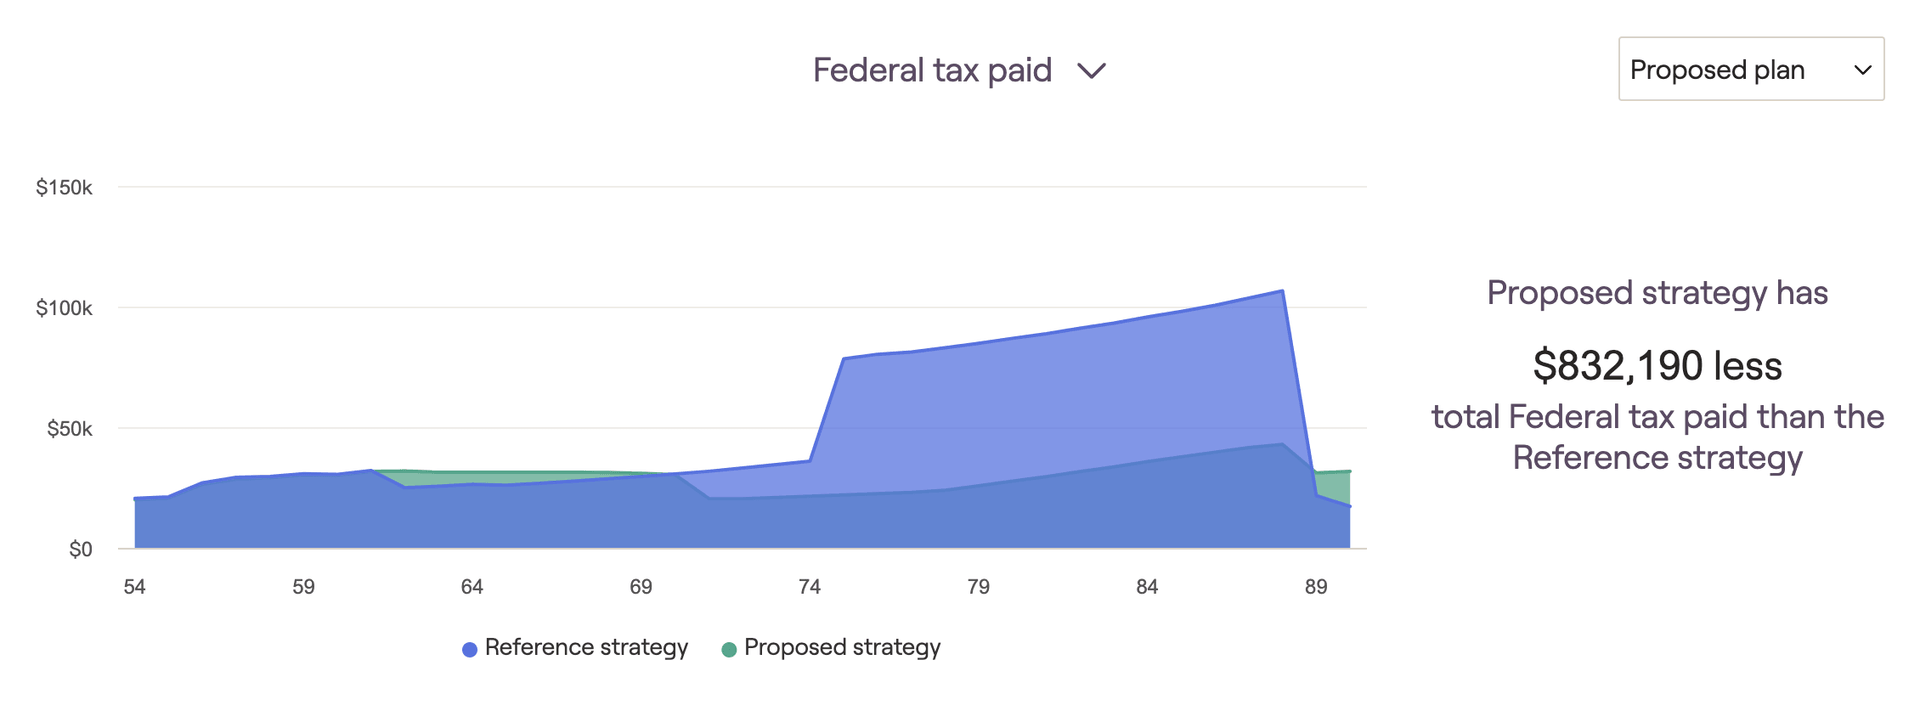
The Federal tax paid chart compares the client's estimated tax burden throughout the projections. Hover your mouse over the chart to track annual federal tax payments each year. The key metric to the right of the chart will display the client's tax savings as a result of your proposed tax strategy:
The Required minimum distributions chart highlights the difference in RMDs between your proposed and reference strategies. Hover your mouse over the chart to track annual RMDs for each strategy. The key metric to the right of the chart will display the cumulative difference between the proposed and reference strategies:
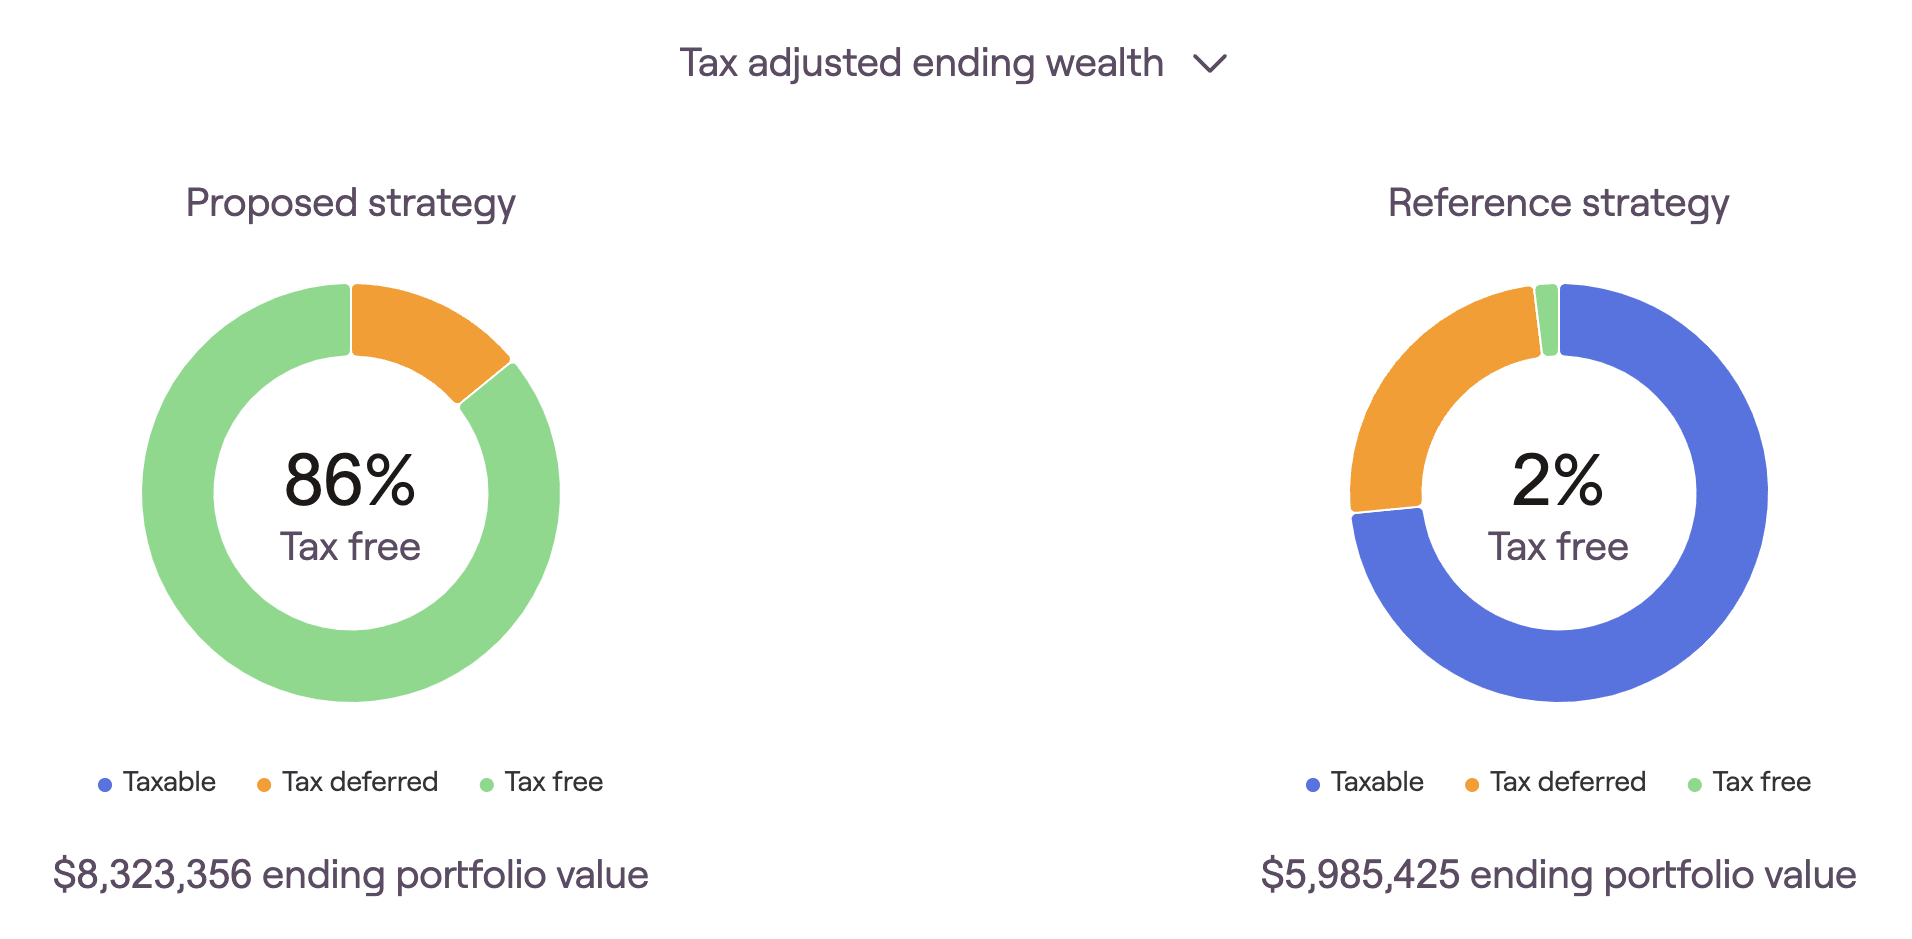
The Tax-adjusted ending wealth screen provides two pie charts, detailing the end-of-plan investment portfolios for the proposed and reference strategies respectively. Here you will find a breakdown of each strategy in terms of overall ending portfolio value, in addition to how that portfolio is divided between the three tax buckets.
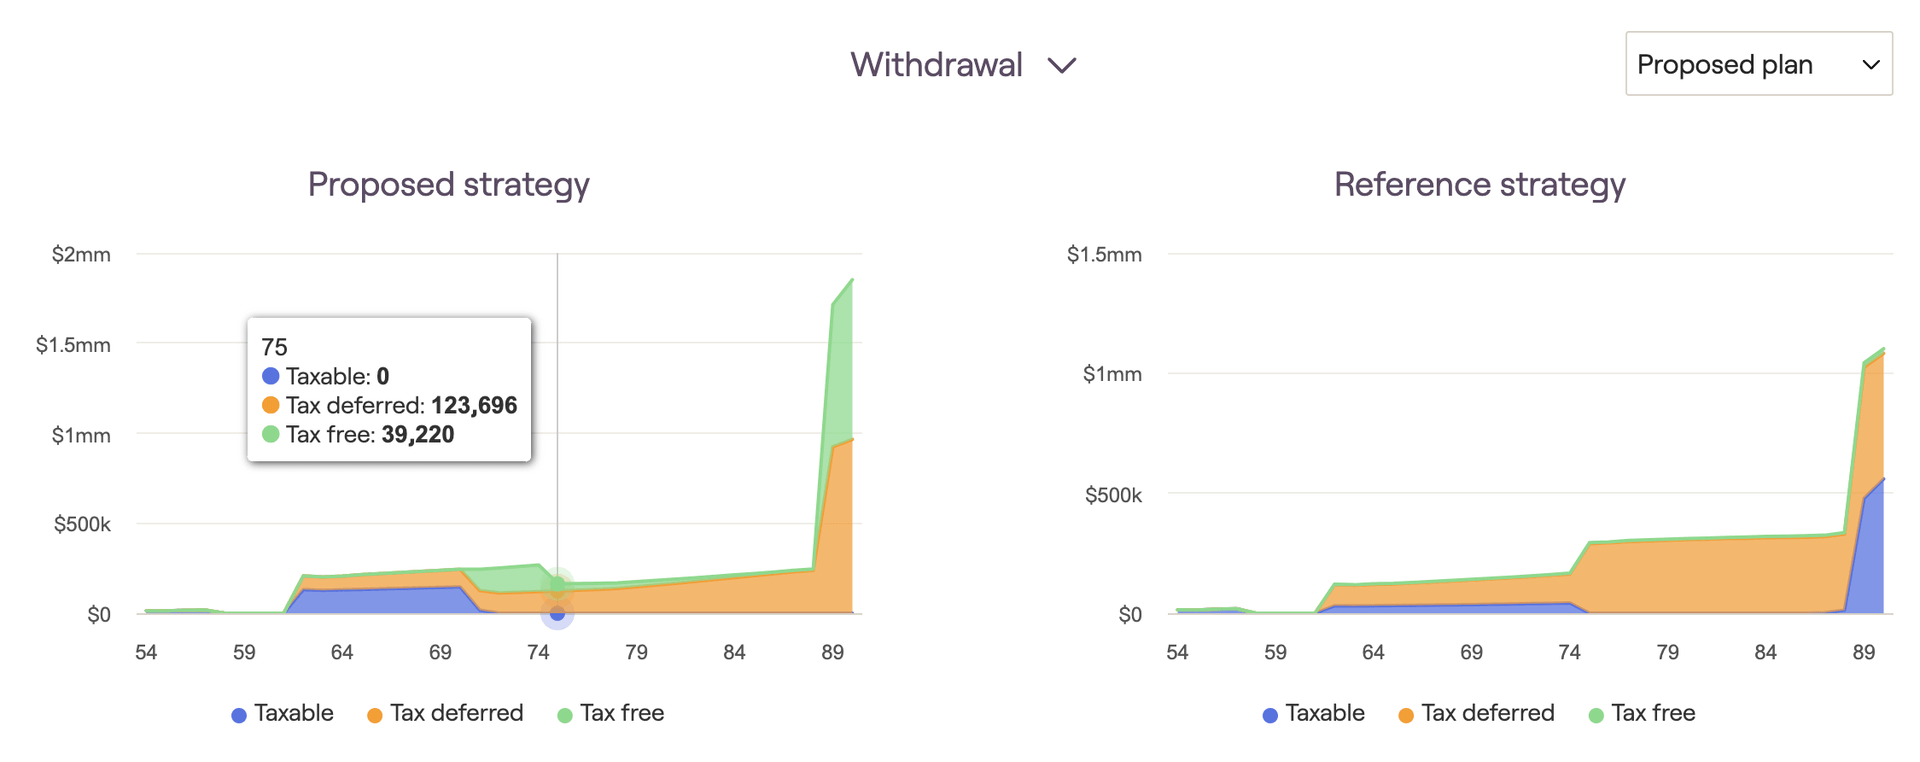
The Withdrawal screen compares taxable, tax-deferred, and tax-free withdrawals between your proposed and reference strategies. Hover your mouse over each chart to track specific dollar values for each year:
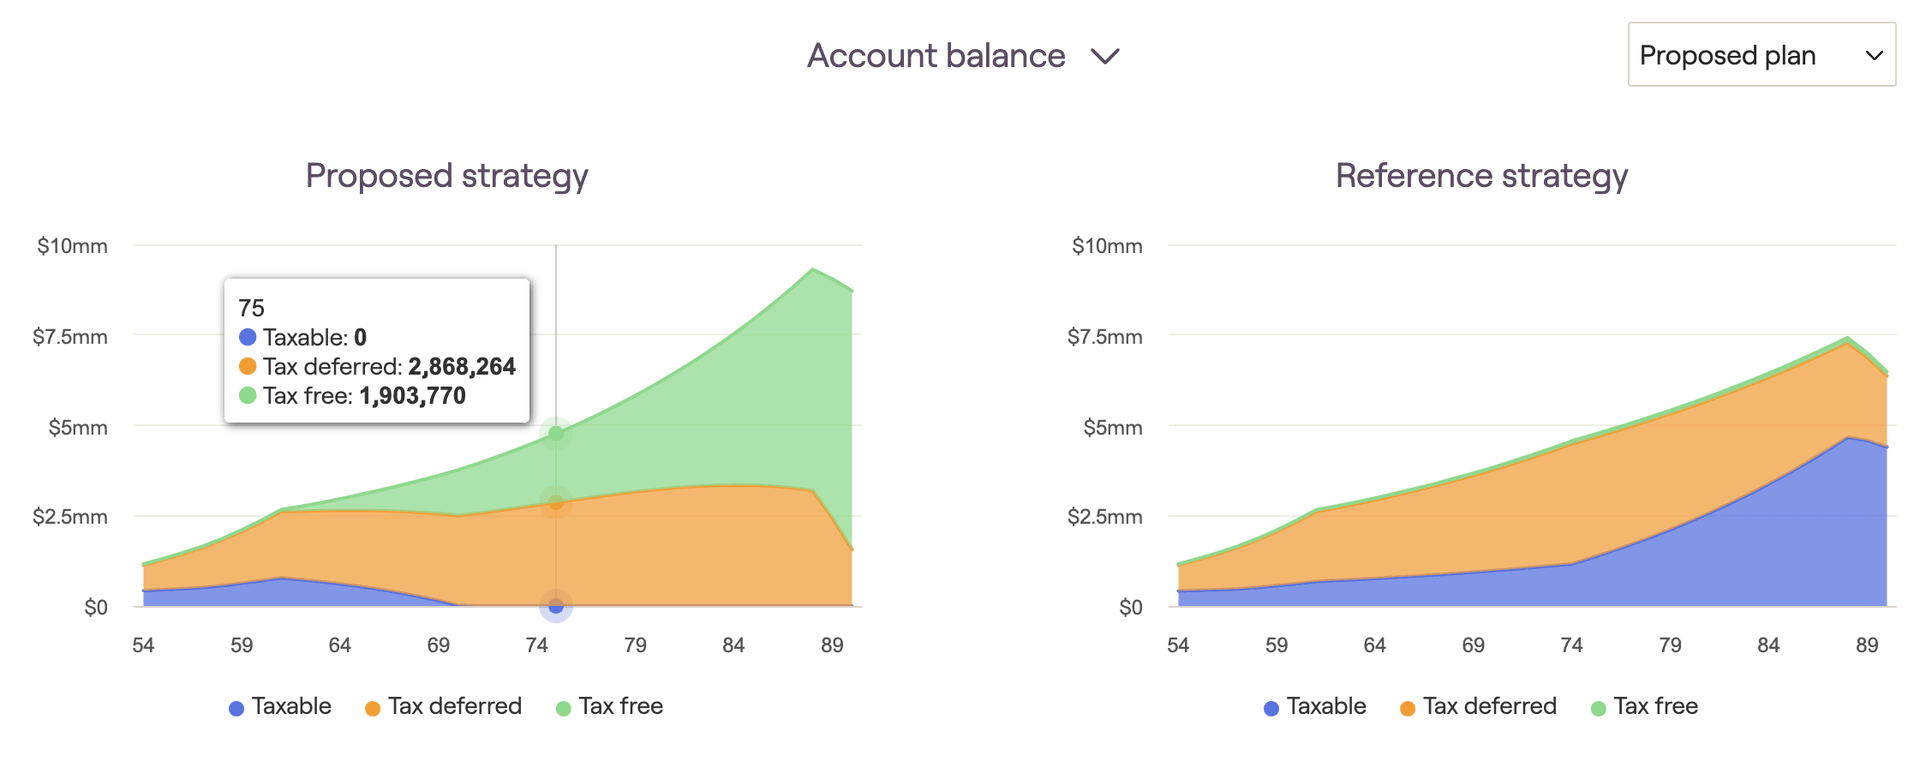
The Account balance screen compares taxable, tax-deferred, and tax-free account balances between your proposed and reference strategies. Hover your mouse over each chart to track specific dollar values for each year:
Details Tab
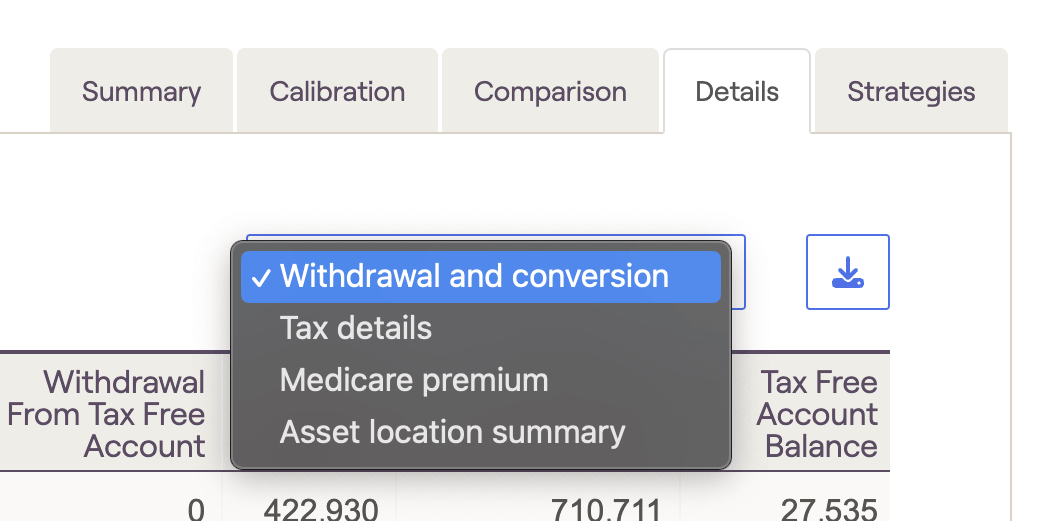
The Details tab is where you can find a number of cash flow tables, breaking things down into specific dollar values that can tracked throughout the future projections. Here you can see the impact of different tax strategies on account balances and withdrawals, tax brackets and federal tax payments, and Medicare premiums. Use the dropdown menu in the upper right corner to switch between the four options:
Please note that the Details tab will reflect whichever plan is currently selected within the other Tax Strategy tabs. You can toggle between current, proposed, and additional plans using the dropdown in the upper right of the other four tabs.
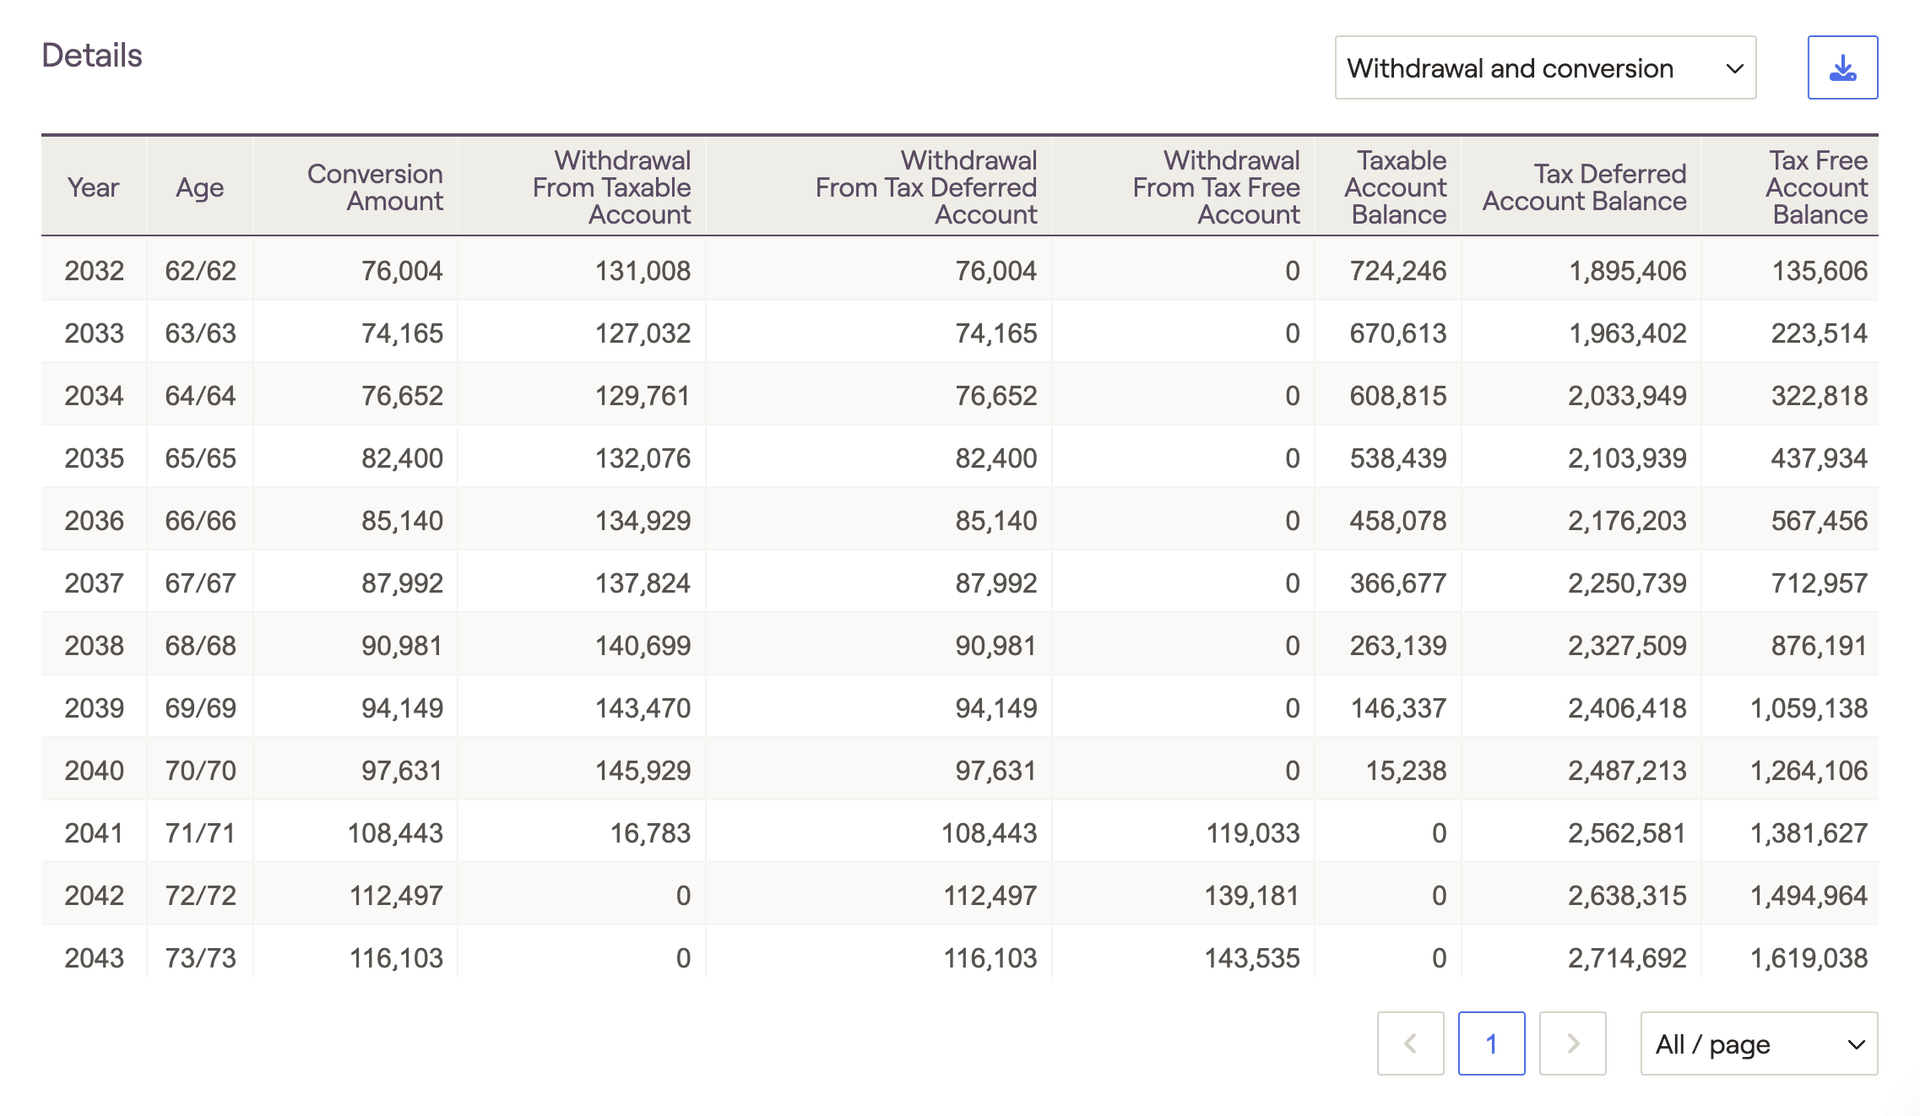
The Withdrawal and conversion table illustrates precise Roth conversion amounts each year, as well as other taxable, tax-deferred, and tax-free account data. Conversion amounts are calculated based on your Roth conversion strategy, and can be tracked in the 'Conversion Amount' column to the far left. The remaining columns will track withdrawals and ending account balances for each tax bucket throughout the plan:
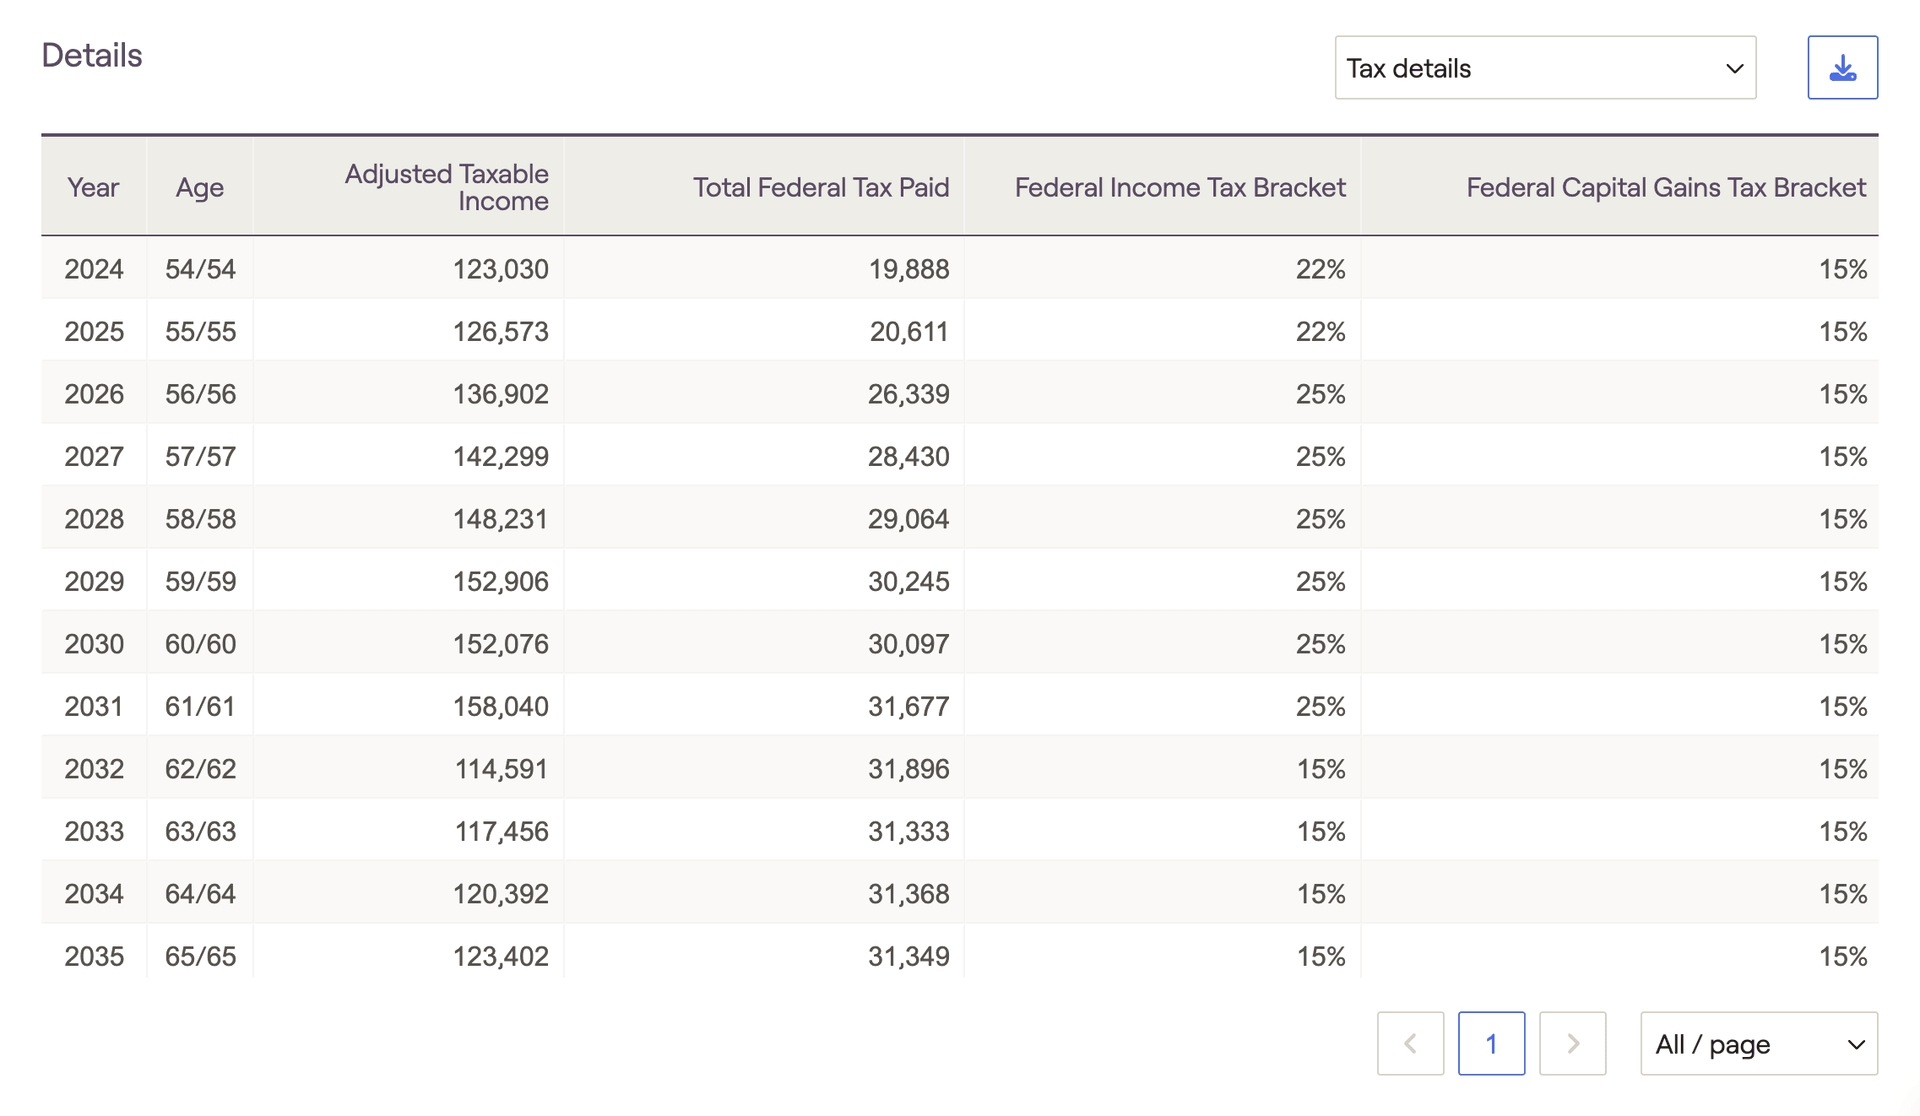
The Tax details table highlights crucial tax information, including adjusted taxable income, federal taxes paid, and the maximum ordinary income and capital gains tax brackets for each year:
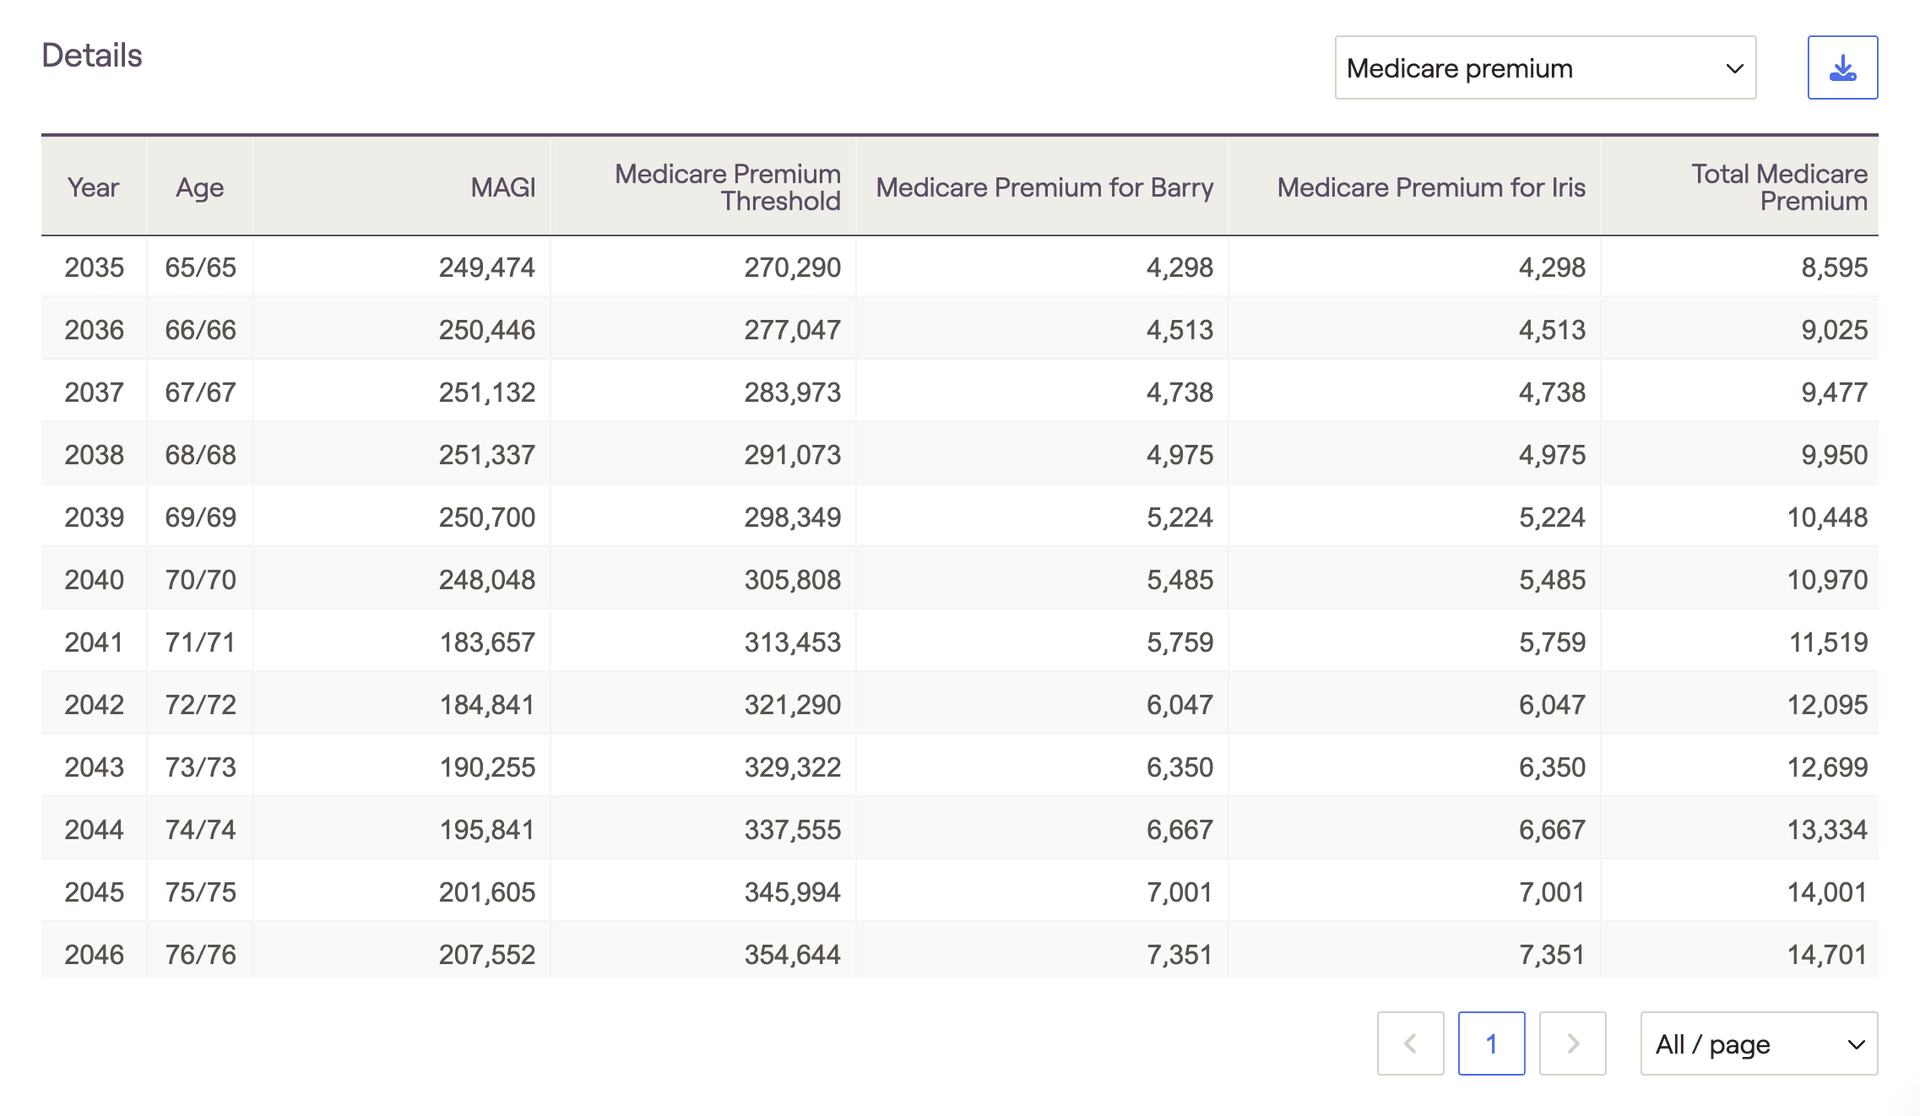
The Medicare premiums table tracks year-to-year MAGI values, IRMAA adjustment thresholds, and medicare premiums paid for each client. Please note that the 'Medicare Premium Threshold' is the lowest IRMAA bracket (indicating the point at which Medicare premiums will be increased).
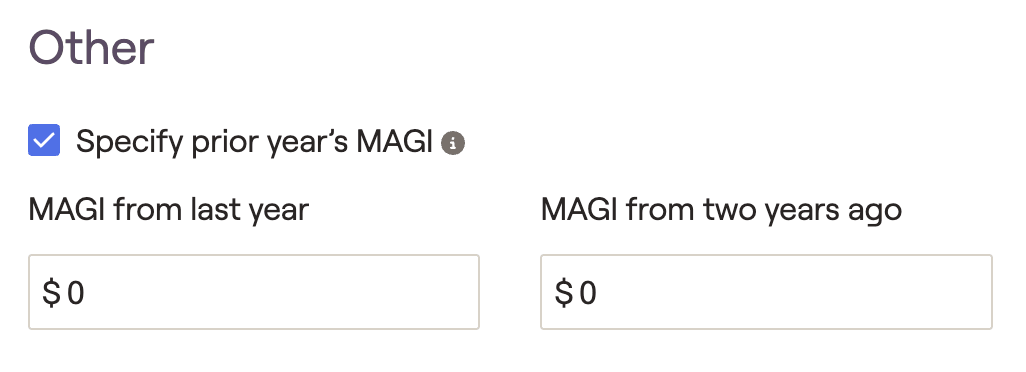
There is a two-year MAGI lookback when calculating monthly premium adjustments due to IRMAA. You can enter a client's MAGI from the prior two years within the Gear Icon > Settings > Tax Assumptions tab of their plan:

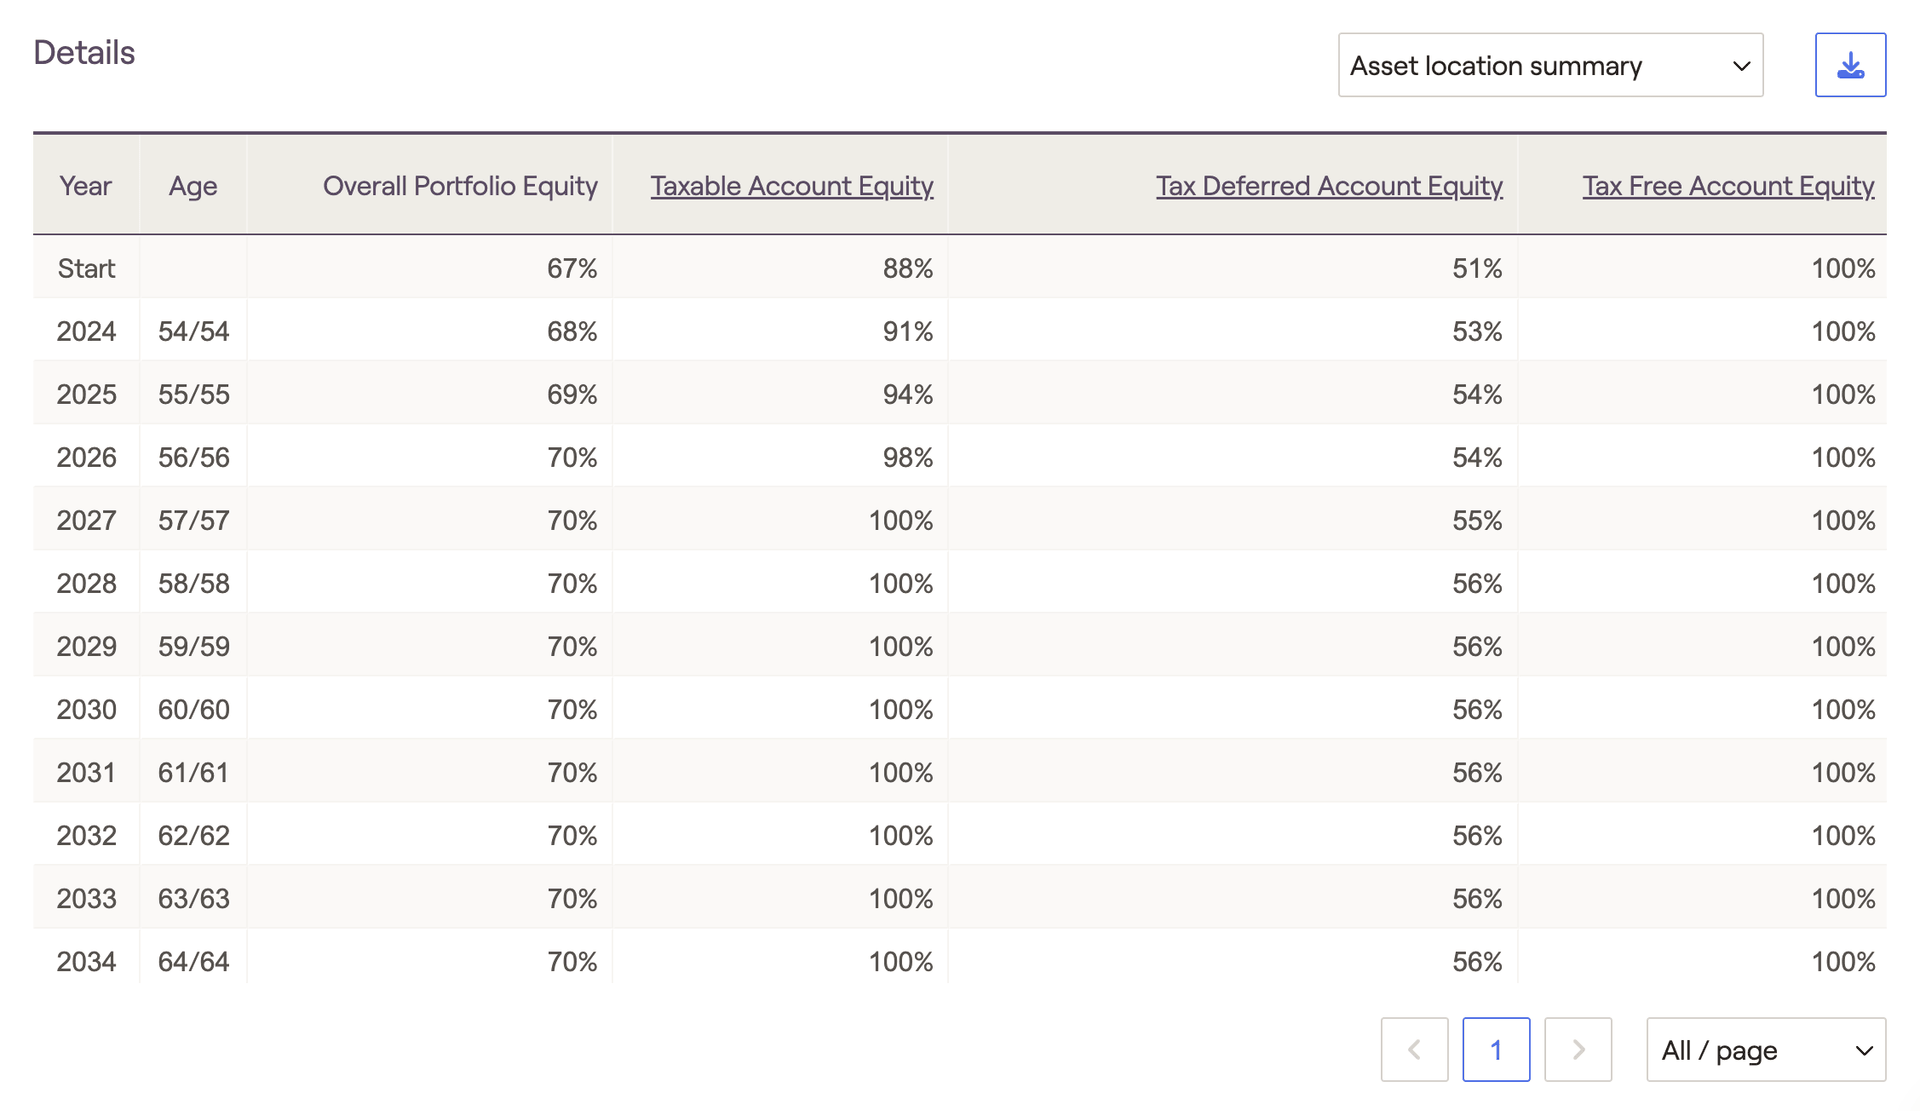
The Asset location summary table tracks changes in a client's asset location each year. The column on the left displays the percentage of equity within the overall portfolio, and each subsequent column tracks equities within the three tax buckets. The 'Start' year will correspond with the Asset location chart in the Summary tab, factoring in the Asset location strategy that you've selected in the Action Items:
Click into the underlined column headers to see which accounts are excluded from the asset location strategy:
Strategies Tab
It can sometimes be difficult to know where to begin when implementing tax strategies, especially for prospects and newer clients. In these instances, the Strategies tab can be leveraged to automatically calculate the top five tax strategy combinations to help maximize a client's ending portfolio value:
After the calculation has been run, the top five strategies will be saved in this area. If you make updates to the data entry within the plan, the calculation will need to be re-run to account for your changes. A new message will appear asking you to recalculate the results:

For example, maybe you want to run a dedicated Roth conversion analysis, without considering asset location or withdrawal sequence:
Applying Your Tax Strategies in the Retirement Analysis
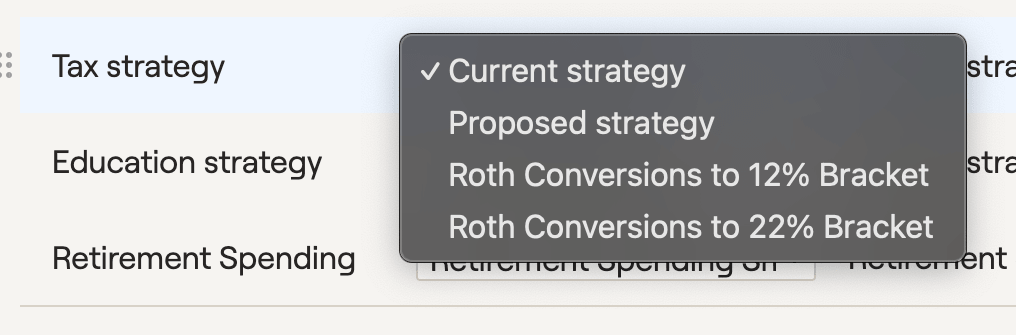
After dialing in a tax strategy within the Tax module, you can then choose to instantly reflect your strategy within any retirement proposal. To apply a tax strategy proposal, visit the Retirement Analysis module and access the action items at the bottom of the screen. On the right side of the action items, isolate the 'Tax Strategy' dropdown, and choose the 'Proposed Strategy' option. Once you click Refresh in the lower right, details from the Tax Strategies module will flow into the Proposed plan:
Creating Multiple Tax Proposals
When creating tax strategies, you are not limited to a single proposal. Just like the Retirement Analysis module, you can create and save multiple sets of tax proposals to be implemented across one or more of your proposed plans.
To create additional tax proposals within the Tax Strategies module, click the Edit button in the lower right and then click 'Add Strategy'. You can also copy an existing proposal by clicking '...' > Copy. After naming and saving more than one tax proposal, you will be able to toggle between which proposal you are working are within the Action Items. This can be done via the dropdown menu on the lefthand side:
Creating multiple tax proposals within the Tax Strategies module also allows you to choose which proposal to implement within the Retirement Analysis module. Your new tax proposals will appear in addition to the original current and proposed strategies. This functionality allows you to mix and match different tax proposals for different proposed plans, or to directly compare two different tax strategies side by side within the context of the Monte Carlo analysis: