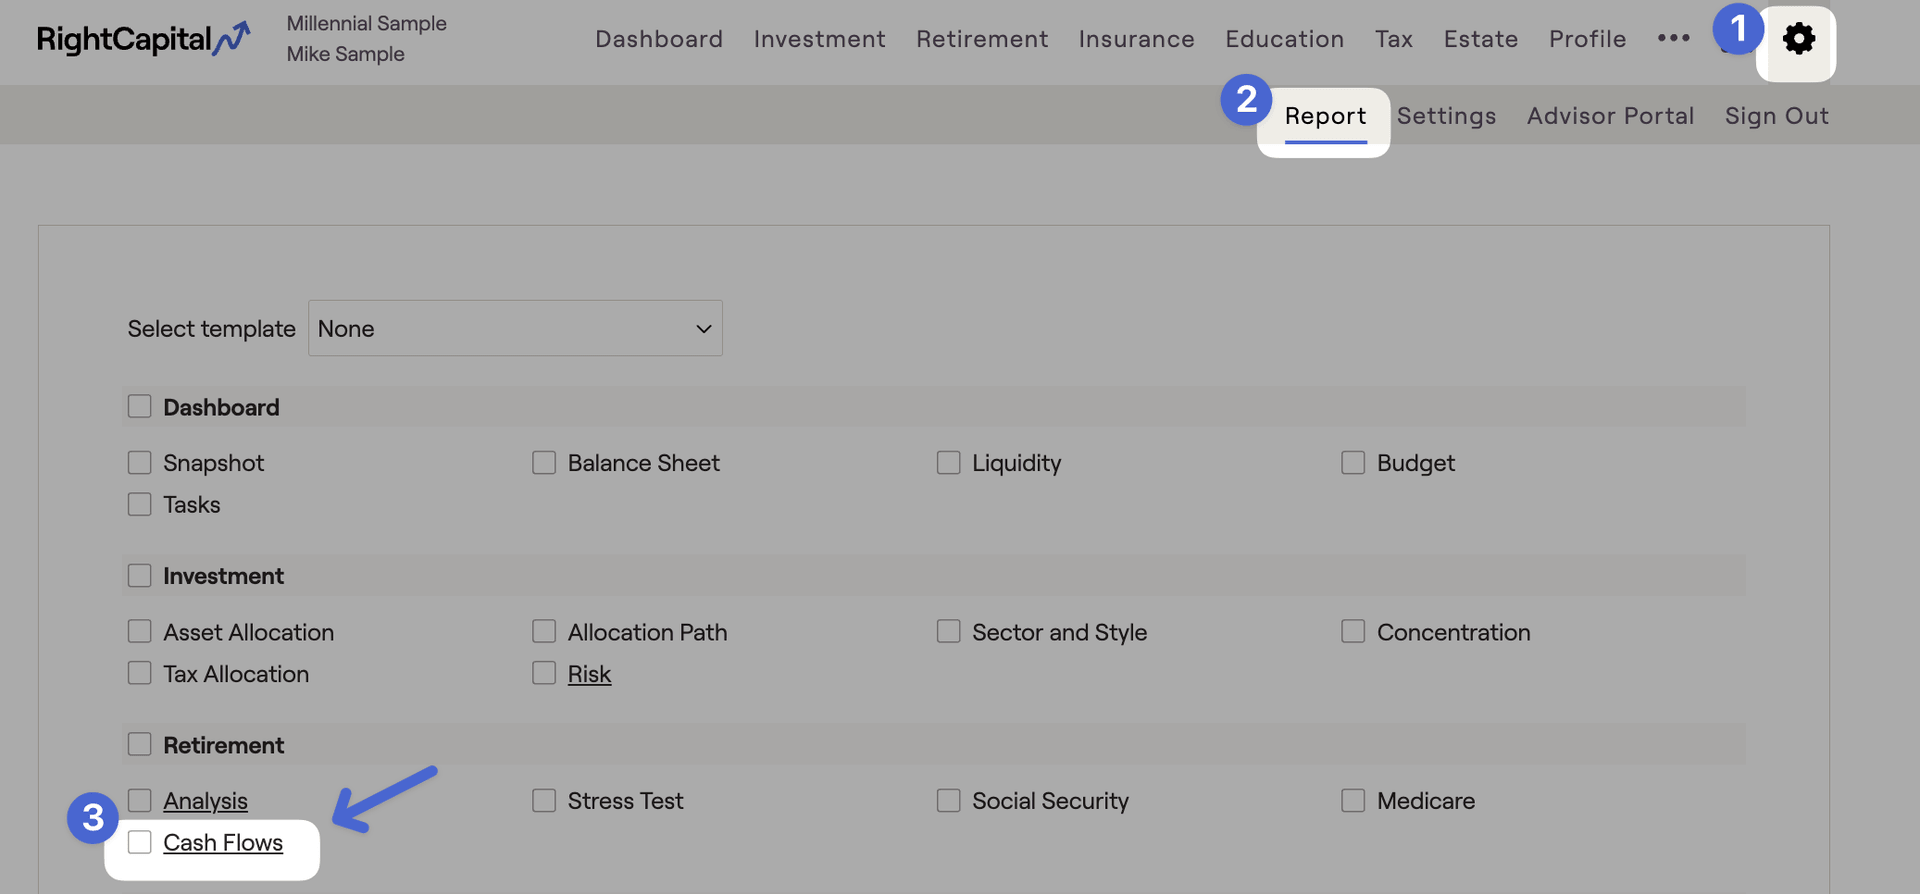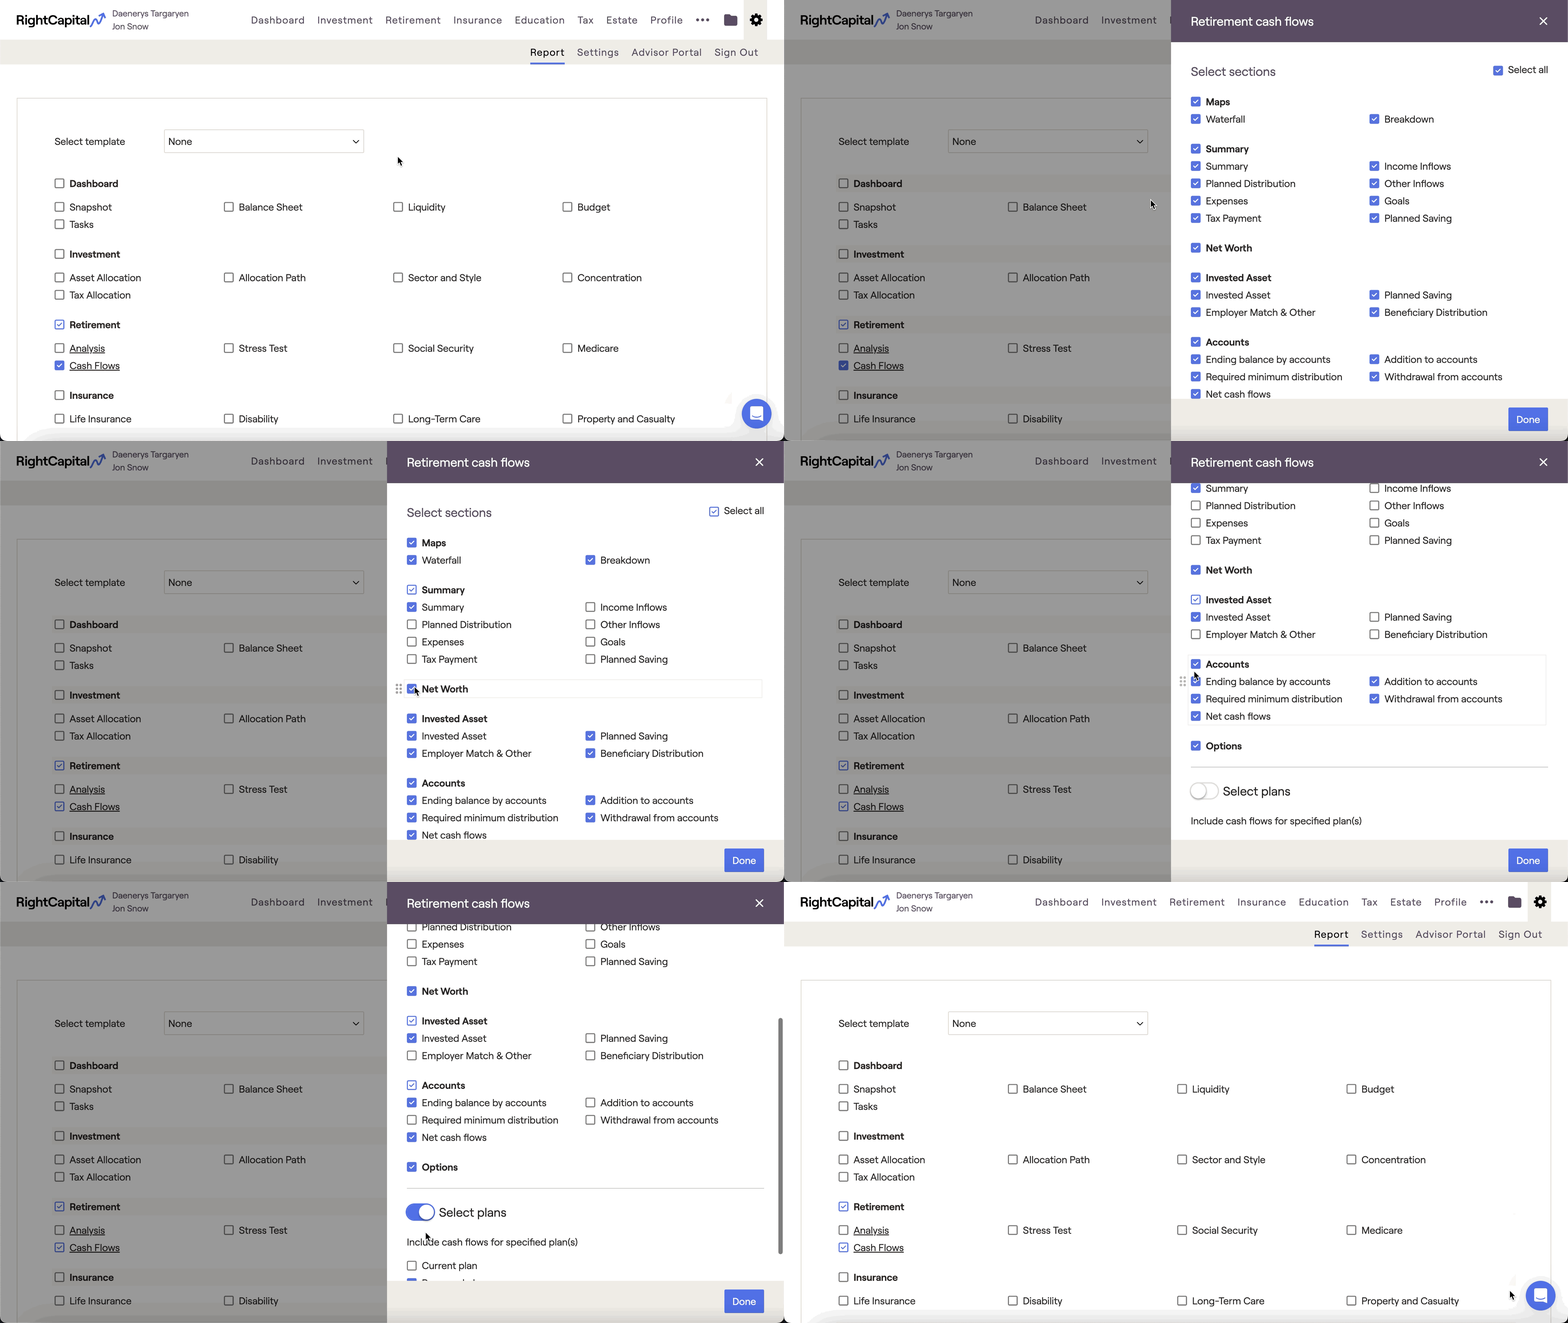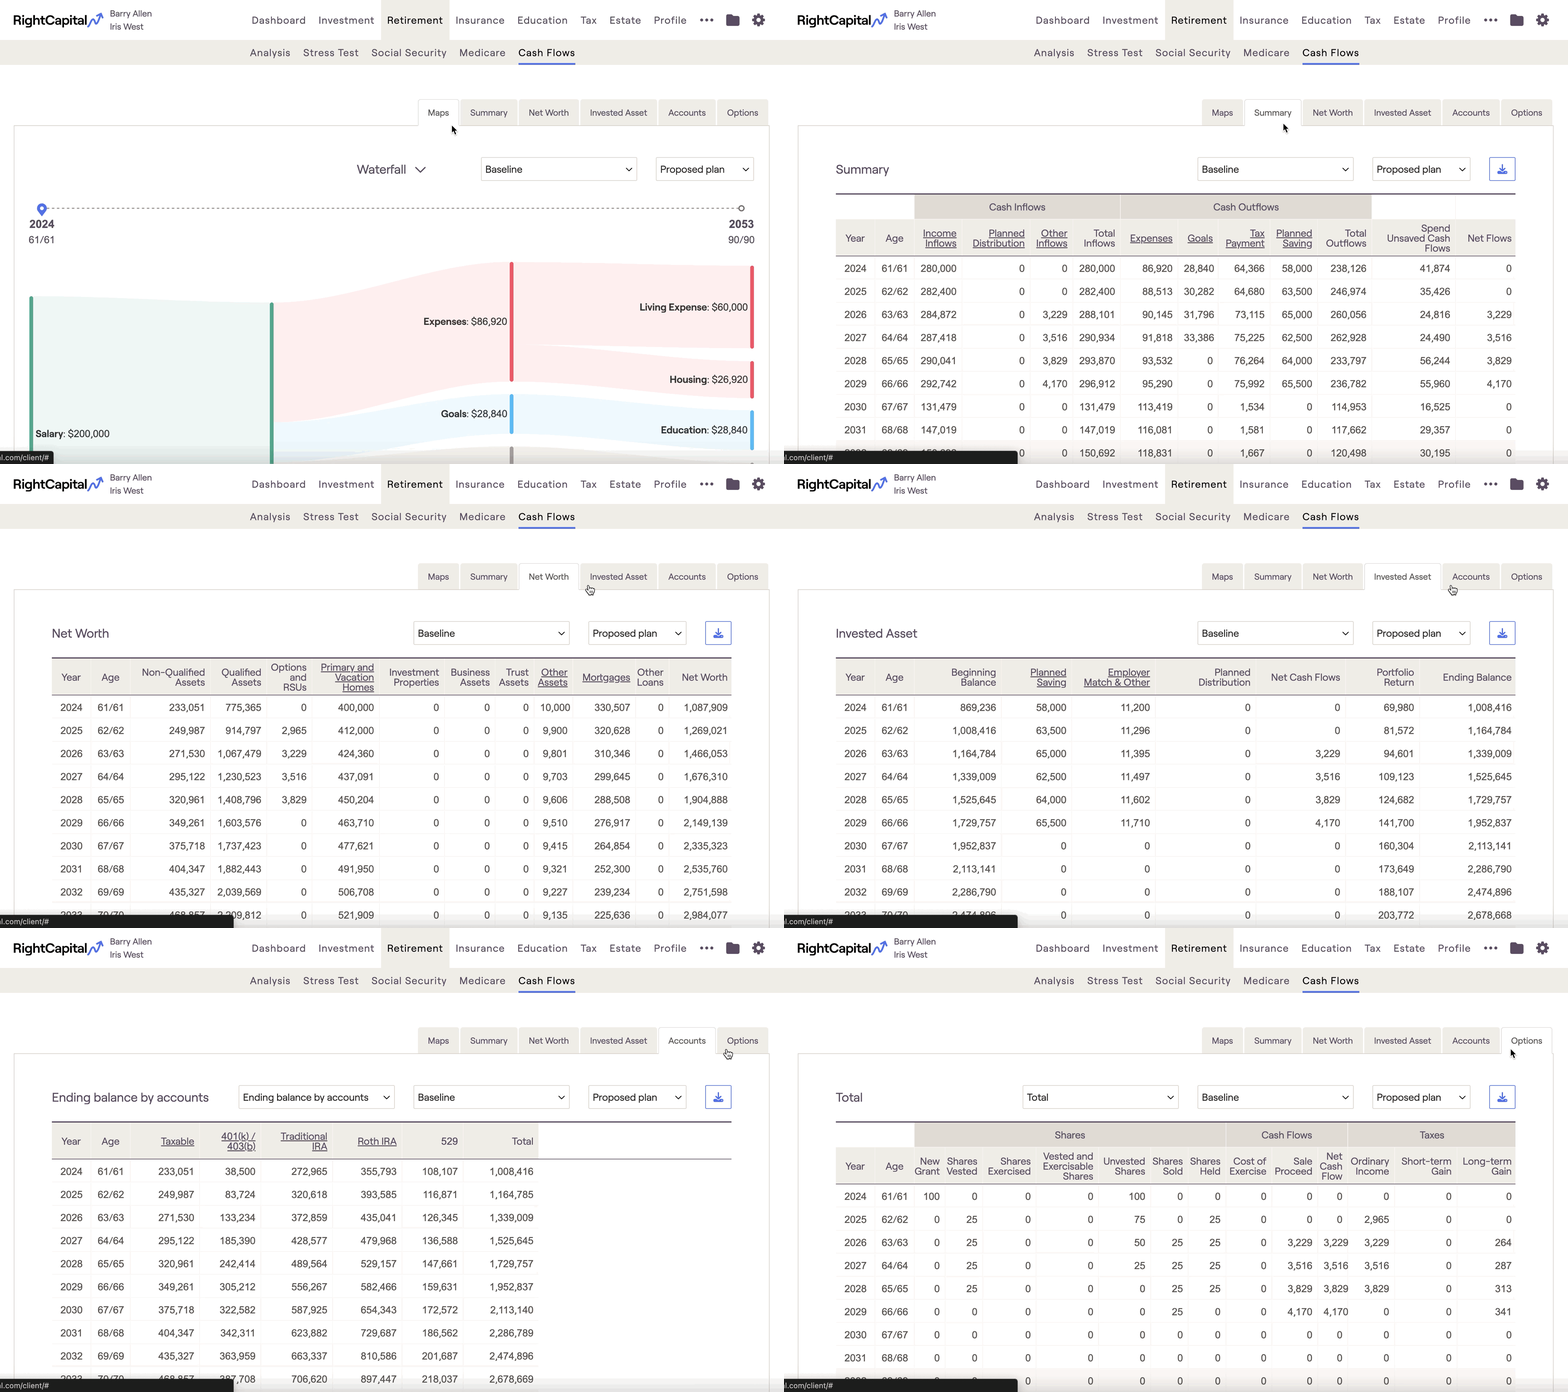
If you'd prefer to watch a video overview of the Cash Flows module, click the link below to watch our dedicated training video:
Maps Tab
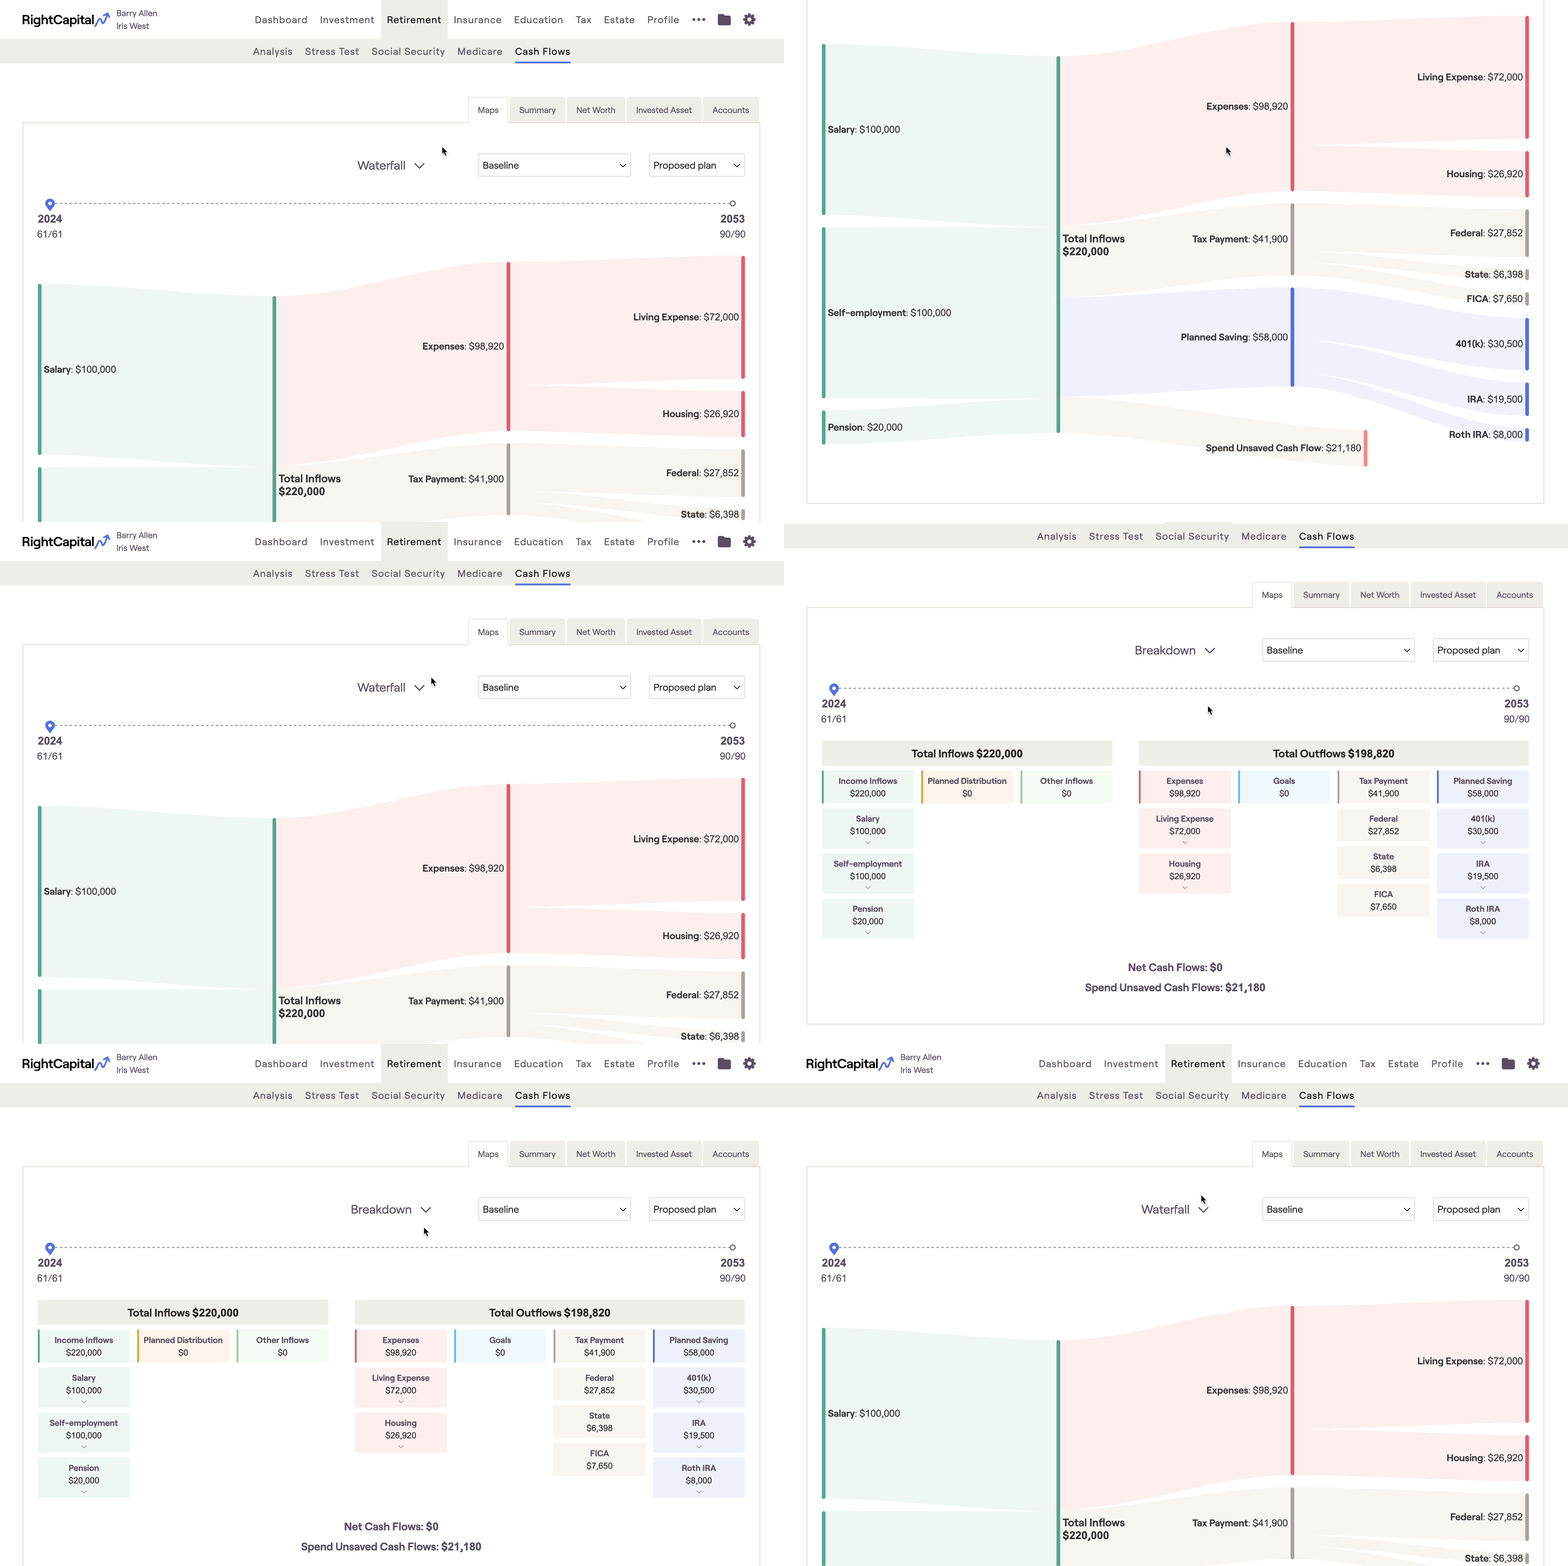
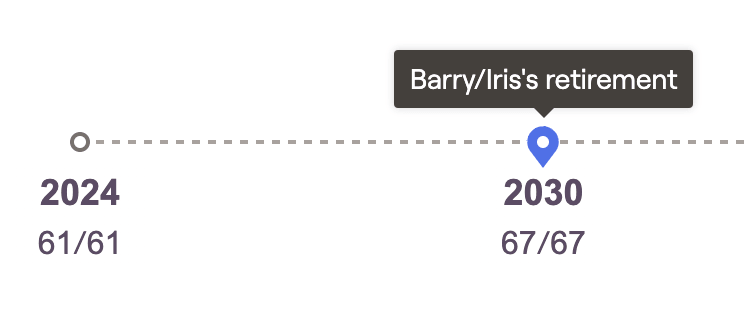
Above the chart you will find a timeline; drag the pin icon along the timeline to select a specific year of the Cash Flows. A tooltip will appear to help you easily identify the year that each client retires:
Waterfall
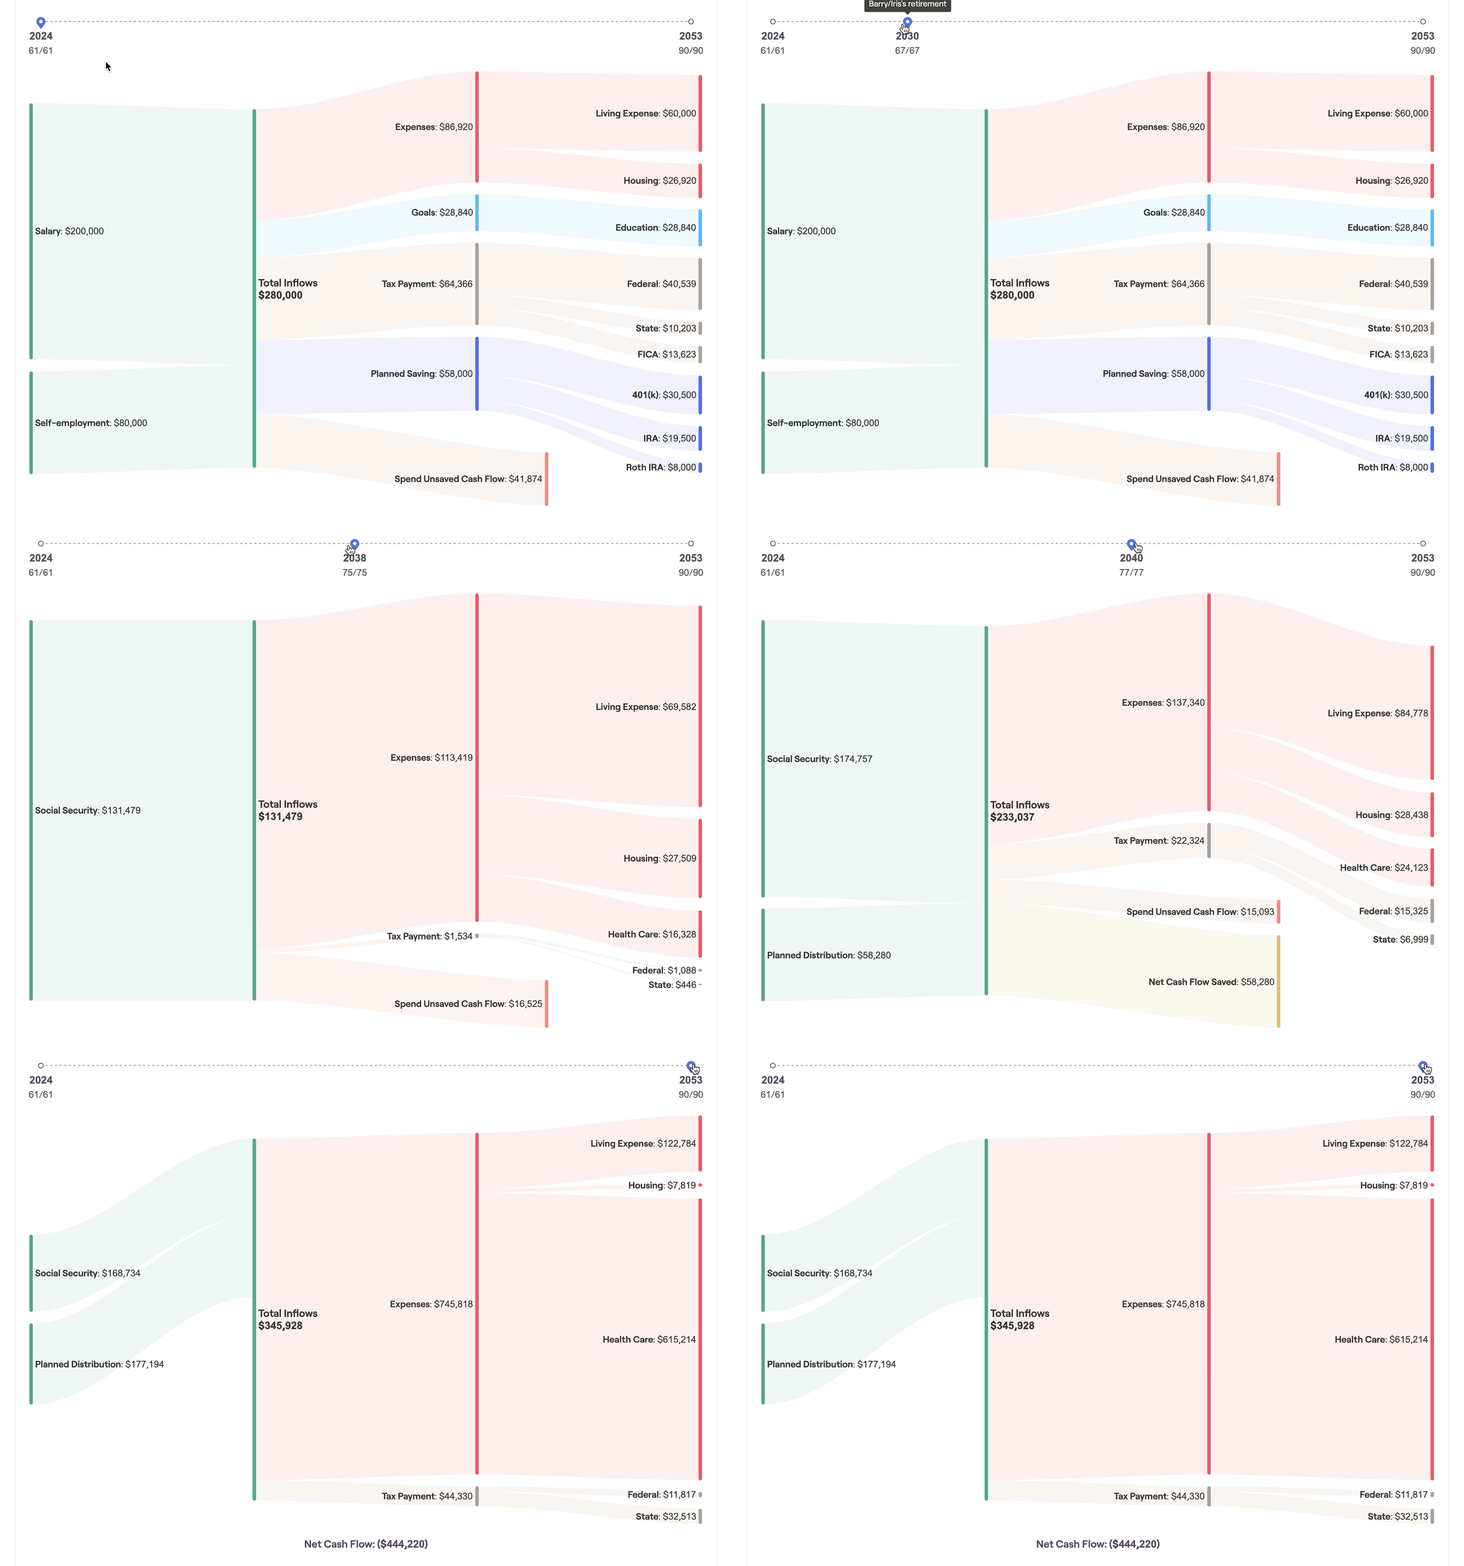
As you scroll through the timeline, you can start to paint a picture for clients, detailing how their income, savings, goals, and expenses might change over the course of their financial lives. This can be a powerful visual backdrop for your planning conversations, and an invaluable tool for client meetings and presentations.
The values displayed here are identical to those found in the Summary tab. For clients who may have difficulty reading and understanding a more traditional cash flow table, Maps can be a useful visual aid in demonstrating where their money is coming from, and where it is going each year.
Breakdown
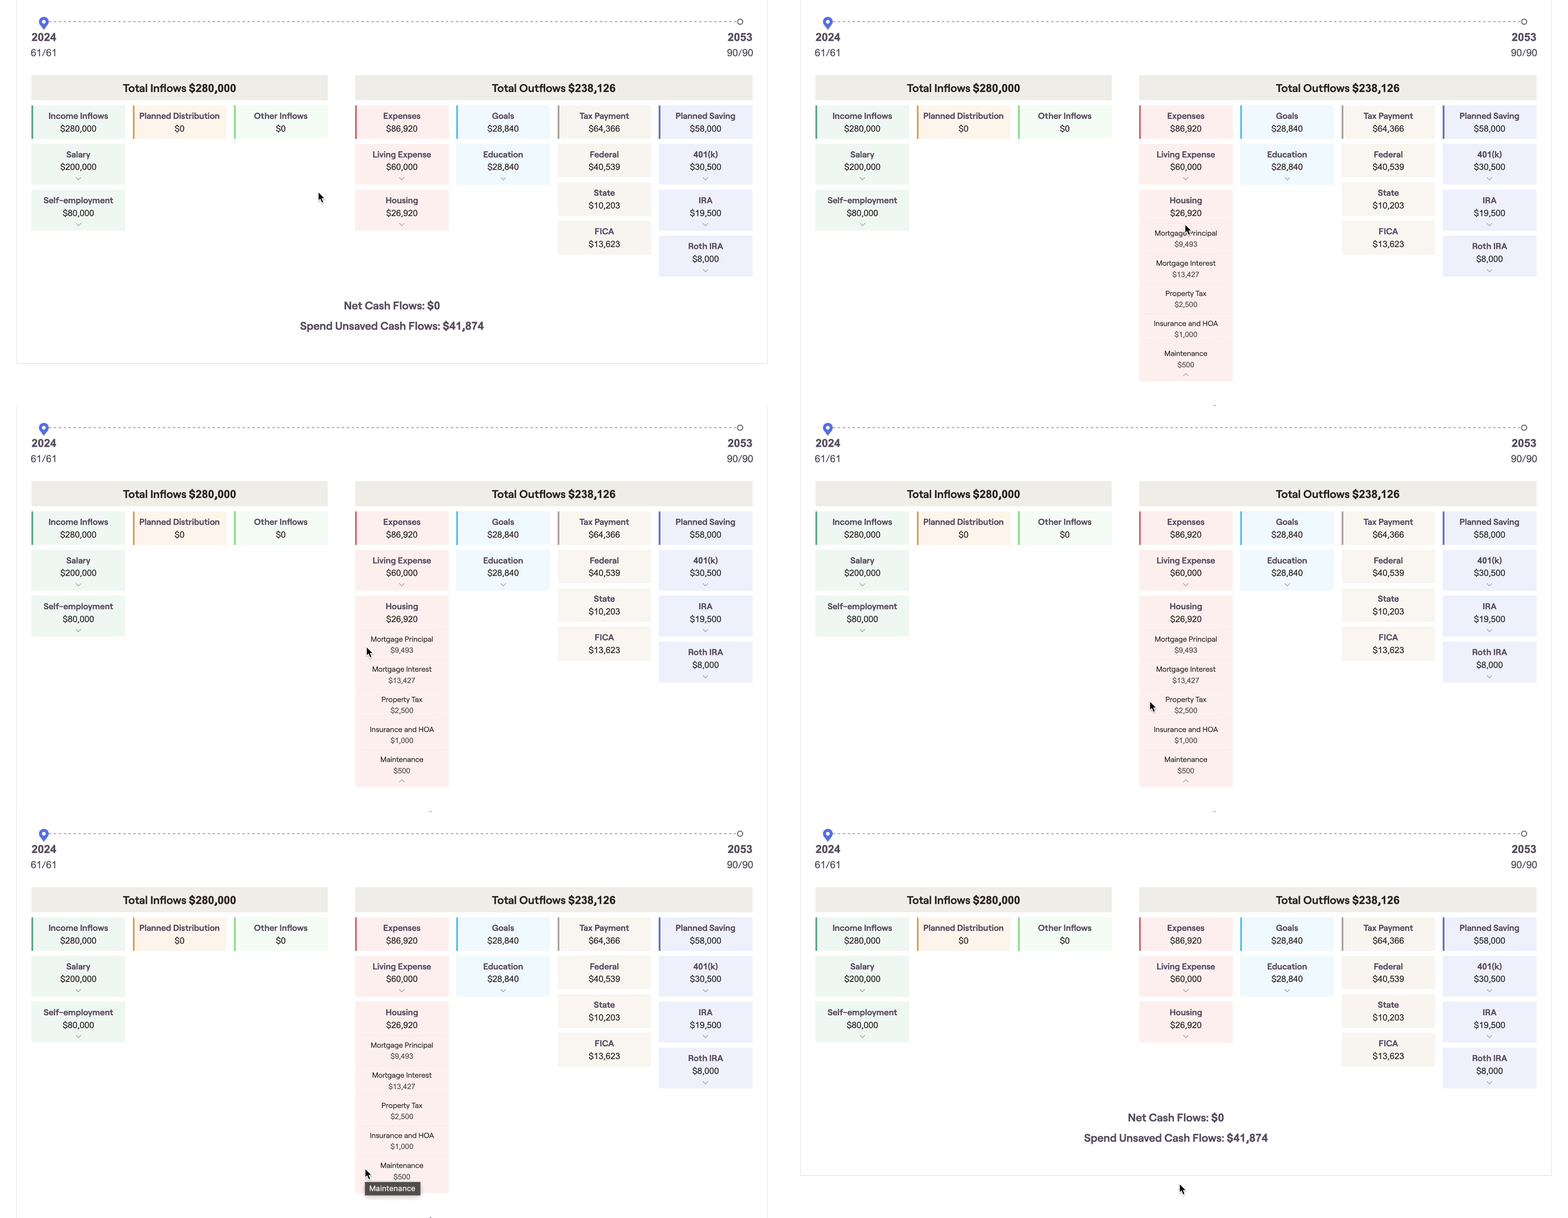
This chart combines visual simplicity with dynamic granularity, allowing you to click into individual tiles to "zoom in" for more detailed cash flow information. Just like the waterfall, this chart focuses in on one cash flow year at a time using the navigational timeline above the chart.
Summary Tab
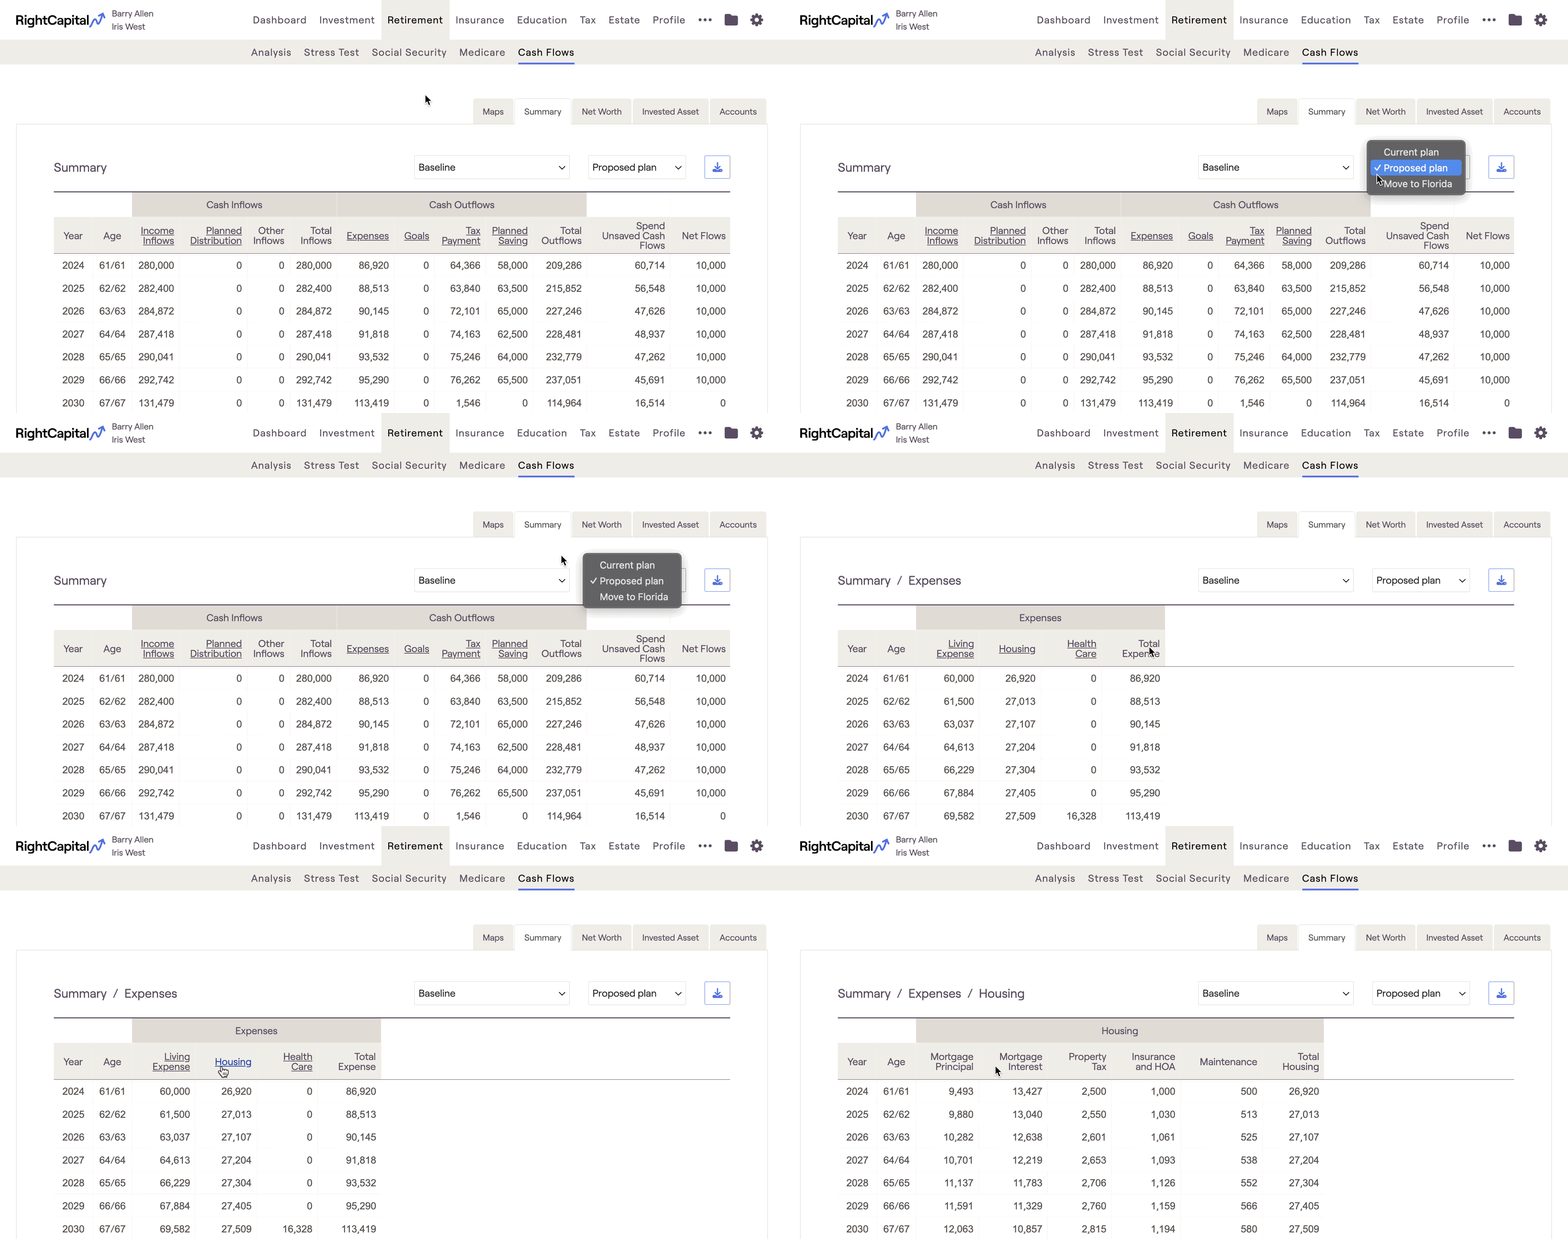
Cash Flow Summary Tab | Definition |
|---|---|
Income Inflows | Total income from salary, pensions, etc. |
Planned Distribution | Includes: Required Minimum Distributions (RMDs) from tax-deferred accounts, Income distributions from qualified accounts, distributions from 529 plans to fund college goals, and distributions from HSA accounts. |
Other Inflows | Additional inflows such as the sale of property/business and insurance proceeds. |
Total Inflows | Equals the sum of Income Flows, Planned Distribution, and Other Inflows. |
Expenses | Total expenses |
Goals | Total financial goals |
Tax Payment | Reflects an estimate of the client's taxes |
Planned Savings | Total savings into qualified (tax-deferred or tax-free) accounts for the client (& spouse). Does not include savings specified into taxable accounts under the Modified Cash Flow or Goal Based calculation methods. |
Total Outflows | Equals the sum of Expenses, Financial Goals, Tax Payment, and Planned Savings. |
Spend Unsaved Cash (Modified Cash Flow Only) | Reflects the amount that is automatically spent under the Modified Cash Flow calculation. |
Net Flows | When using Cash Flow Based planning method, this value equals total inflows less total outflows. When using Modified Cash Flow Based planning method, this value equals total inflows less total outflows & spend unsaved cash flows. Any positive values are assumed saved into the taxable assets. |
To learn more about the Planning Method setting and its impact on the Cash Flows, click the link below:
Income Inflows

Income Inflows | Definition |
|---|---|
Salary | Reflects all amounts entered in Salary cards. |
Self-employment | Reflects all amounts entered in Self-employment cards. |
Social Security | Reflects all Social Security benefits based on the Social Security strategy, plus any amounts entered in an 'Other Income' card with Tax status of Social Security. |
Pension | Reflects all amounts entered in Pension cards. |
Annuity | Reflects all amounts entered in Annuity cards on the Income screen, plus income derived from annuity accounts set up in the Net Worth screen or in the Income Strategy section of the Retirement Analysis action items, whether through annuitization or lifetime income riders. |
Investment Income | Reflects investment income (interest + dividends) from taxable accounts during retirement. This column will only appear if the appropriate methodology setting is checked off which distributes income from taxable accounts in retirement rather than reinvesting it. |
Business Income | Reflects all amounts entered as business distributions in an Other Account card with a type of business. |
Trust Income | Reflects income from investment accounts owned by a Trust. |
Other Income | Reflects all amounts entered in Other, Child Support, Alimony, Royalties, or Inheritance income cards, as well as income from a Note Receivable, entered on the Profile > Net Worth screen under 'Other' account. |
Total Income Inflows | Equals the sum of all of the prior values on this screen. |
Planned Distribution

The 'Planned' Distribution' column is where you will find distributions from a client's investments. This includes:
Required Minimum Distributions, once a client reaches RMD age
Manual distributions, entered using Income Distribution cards within the current or proposed plans
Automatic distributions from HSAs, 529s, etc. at designated times within the plan
Other Inflows

Other Inflows | Definition |
|---|---|
Rental Income | Reflects rental income set up in an Investment Property card on the Net Worth screen. |
Sale of Real Estate | Reflects the sale of properties, as specified in the cards for Investment Properties or Vacation Homes, or the sale of the primary home through setting up a Relocation Goal. |
Sale of Businesses | Reflects the sale of businesses as specified in an Other Account card with a type of business. |
Sale of Other Assets | Reflects the sale of assets as specified in an Other Account card with a type of Lifestyle. |
Options and RSU | Income from Options, RSUs, or Restricted Stock, from the Options tab. |
Inheritance | Reflects any inheritance income from the Profile / Inheritance screen. |
Insurance Death Benefit | Reflects payout from life insurance upon the passing of the client/spouse. |
Life Insurance Distribution | Reflects loans from whole/universal life policies, or the full surrender of such policies. |
LTC Insurance Benefit | Reflects payout from long term care insurance to offset LTC expenses set up in the Goals screen. |
Total Other Inflows | Equals the sum of all of the prior values on this screen. |
Expenses

Expenses | Definition |
|---|---|
Living Expense | Reflects values set up in the 'Pre-retirement Living Expense' card on the Expenses screen prior to retirement, and values set up in the 'Retirement Expense' card on the Goals screen after retirement. |
Housing | Reflects expenses associated with the Primary Home, including any adjustable-rate mortgage, interest-only mortgage, conventional mortgage, property tax, and insurance. |
Debt | Reflects credit card payments and payments for all types of debt other than conventional mortgage debt, adjustable-rate mortgage debt, and interest-only mortgage debt. |
Health Care | Reflects amounts set up as Medical expenses, amounts entered in the Annual Retirement Health Cost and Annual Retirement LTC Cost cards, and amounts entered in an 'Other' expense card with ‘Tax deductible’ status of ‘Self-employed health care premium’ |
Insurance Premium | Reflects amounts set up as premiums for life, disability, property & casualty, and long term care insurance. |
Rental and Vacation Home | Reflects expenses associated with all Investment/Rental Properties and Vacation Homes, including any mortgage, property tax, insurance, and maintenance. |
Other Expense | Reflects additional expenses such as business/property purchases, money used to exercise options, and most items entered in a 'Charitable Giving', 'Alimony' or 'Other' expense card. |
Total Expense | Equals the sum of all of the prior values on this screen. |
Goals

Goals | Definition |
|---|---|
College | Reflects all amounts set up as College Goals. |
Car | Reflects all amounts set up as Car Goals. |
Vacation | Reflects all amounts set up as Vacation Goals. |
Wedding | Reflects all amounts set up as Wedding Goals. |
Legacy | Reflects amounts set up as Legacy Goals in the last year of the plan. |
Other Goals | Reflects all amounts set up as Other Goals. |
Total Goals | Equals the sum of all of the prior values on this screen. |
Tax Payment
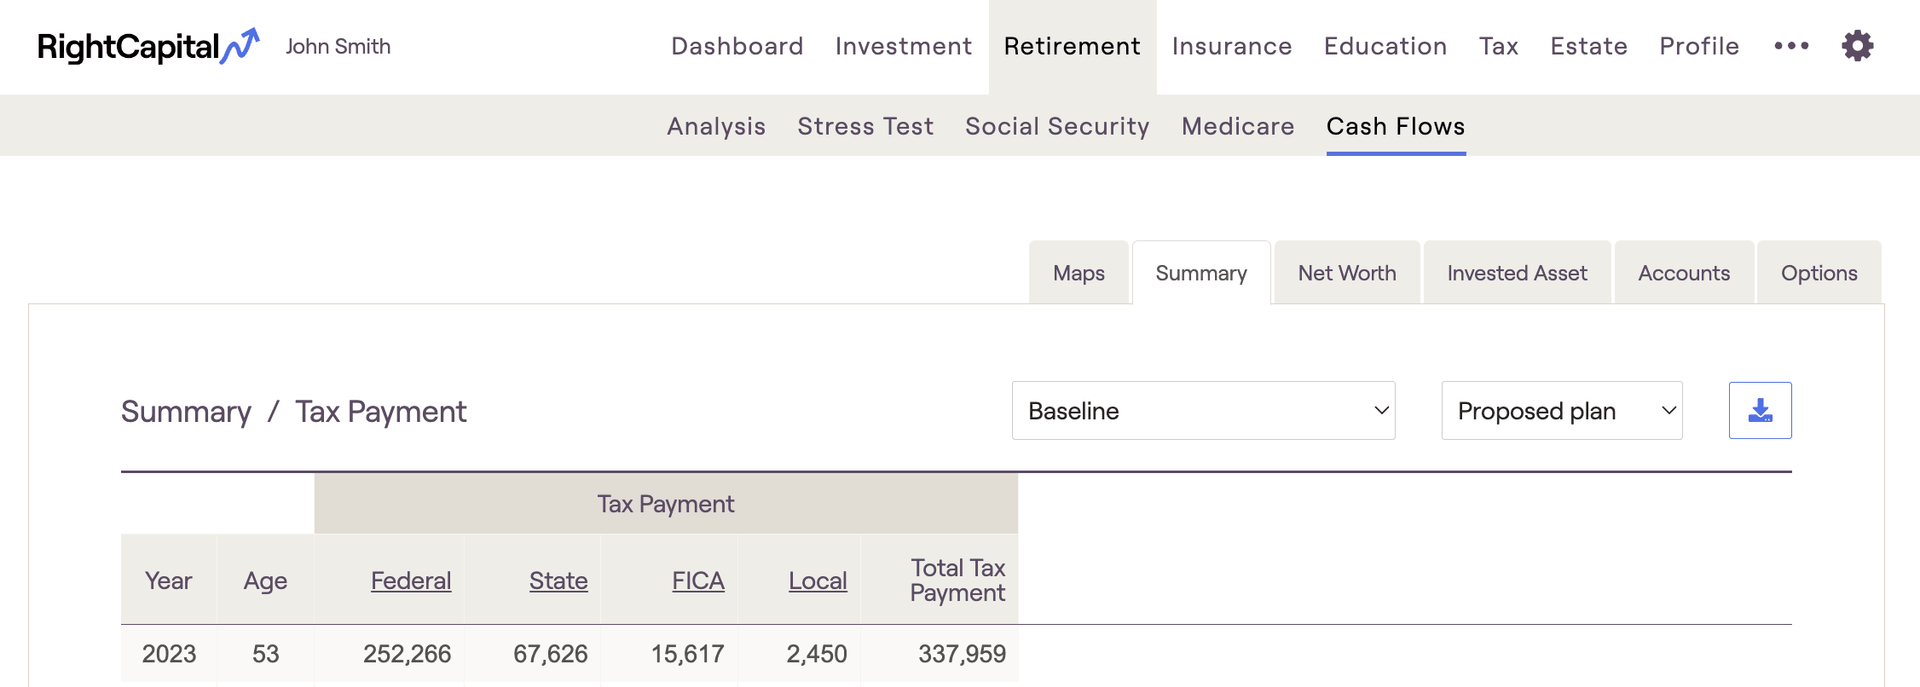
Taxes | Definition |
|---|---|
Federal | Reflects the federal tax projection, as calculated in detail and reflected in the Tax > Tax Estimate > Details screen. |
State | Reflects the state tax projection based on the Resident State set in the Client card on the Family screen. |
FICA | Reflects the FICA tax projection. |
Local | Reflects Local taxes, calculated using the Local tax percentage set in the Tax and Fees card on the Expense screen. |
Total | Equals the sum of all of the prior values on this screen. |
Planned Saving

The 'Planned Saving' column is where you will find contributions that clients are making to their various investment accounts. This includes 401(k), IRAs, 529s, HSAs, and more.
Employer matches / contributions will not be reflected in this column, only employee contributions. To find employer matches within the cash flows, navigate to the Invested Asset tab.
- Taxable Savings will only appear in the planned savings column if you've checked the 'Include taxable saving in Planned Saving column' in Gear Icon > Settings > Methodology. Otherwise, both taxable and bank savings will be reflected in the Net Flows column to the far right.
Net Worth Tab

Net Worth | Definitions |
|---|---|
Non-Qualified Assets | Reflects all taxable investment assets, including Bank assets. |
Qualified Assets | Reflects all tax-deferred and tax-free investment assets. |
Options and RSUs | Reflects the current value of vested but unexercised options. |
Primary and Vacation Homes | Reflects the value of the Primary Home and all Vacation Homes. |
Investment Properties | Reflects the value of all Investment Properties. |
Business Assets | Reflects the value of all business assets set up as an Other Account with a type of business. |
Trust Assets | Reflects the value of investment assets set up with an owner of 'Trust'. |
Other Assets | Reflects the value of all assets set up as an Other Account with a type of Lifestyle. |
Mortgages | Reflects the value of all mortgages. |
Other Loans | Reflects the value of all non-mortgage loans. |
Net Worth | Equals Non-Qualified Assets + Qualified Assets + Primary and Vacation Homes + Investment Properties + Business Assets + Trust Assets + Other Assets - Mortgages - Other Loans. |
Invested Asset Tab

Invested Asset | Definitions |
|---|---|
Beginning Balance | On the first line, represents the current value of all investments. Subsequently, equals the prior year's Ending Balance. |
Planned Saving | Total savings into qualified (tax-deferred or tax-free) accounts for the client (& spouse). Does not include savings specified into taxable accounts under the Modified Cash Flow or Goal-Based calculation methods. Equals the Planned Saving value from the Summary tab. Click into the underlined column header to view additional details. |
Employer Match | Equals the amount calculated as an employer contribution on qualified plans as set up in the 401(k) or Roth 401(k) savings cards, plus any amount entered in an 'Other savings > Tax Deferred' card, 'Other savings > Tax-Free' card, 'Other savings > Cash Balance Pension' card, 'Other savings > Profit Sharing' card, or "Other savings > Employee Stock Ownership Plan' card. Click into the underlined column header to view additional details. |
Planned Distribution | Reflects the total of the following: (1) Required Minimum Distributions (RMDs) from tax-deferred accounts, (2) Income distributions from tax-deferred accounts (as specified as 'Distribution' Income), (3) Distributions from 529 plans to fund college goals, (4) Distributions from HSA accounts to fund medical expenses. Equals the Planned Distribution value from the Summary tab. |
Net Cash Flows | Equals the Net Cash Flows value from the Summary tab. |
Annuity Adjustment | Reflects the Annuitization of an annuity account and withdrawals from annuity accounts to generate guaranteed lifetime income. |
Beneficiary Distribution | Reflects the percentage of the account that is assumed as inherited by the surviving spouse. You can update these figures in our Account Assumptions page. |
Insurance Cash Value Change | Reflects changes in permanent life insurance Cash Value. This field will only be visible when a cash value approach is used within a permanent life insurance policy. |
Portfolio Return | Reflects the total investment return of the investment accounts. |
Ending Balance | Equals the sum of all of the prior values on the tab. |
Accounts Tab
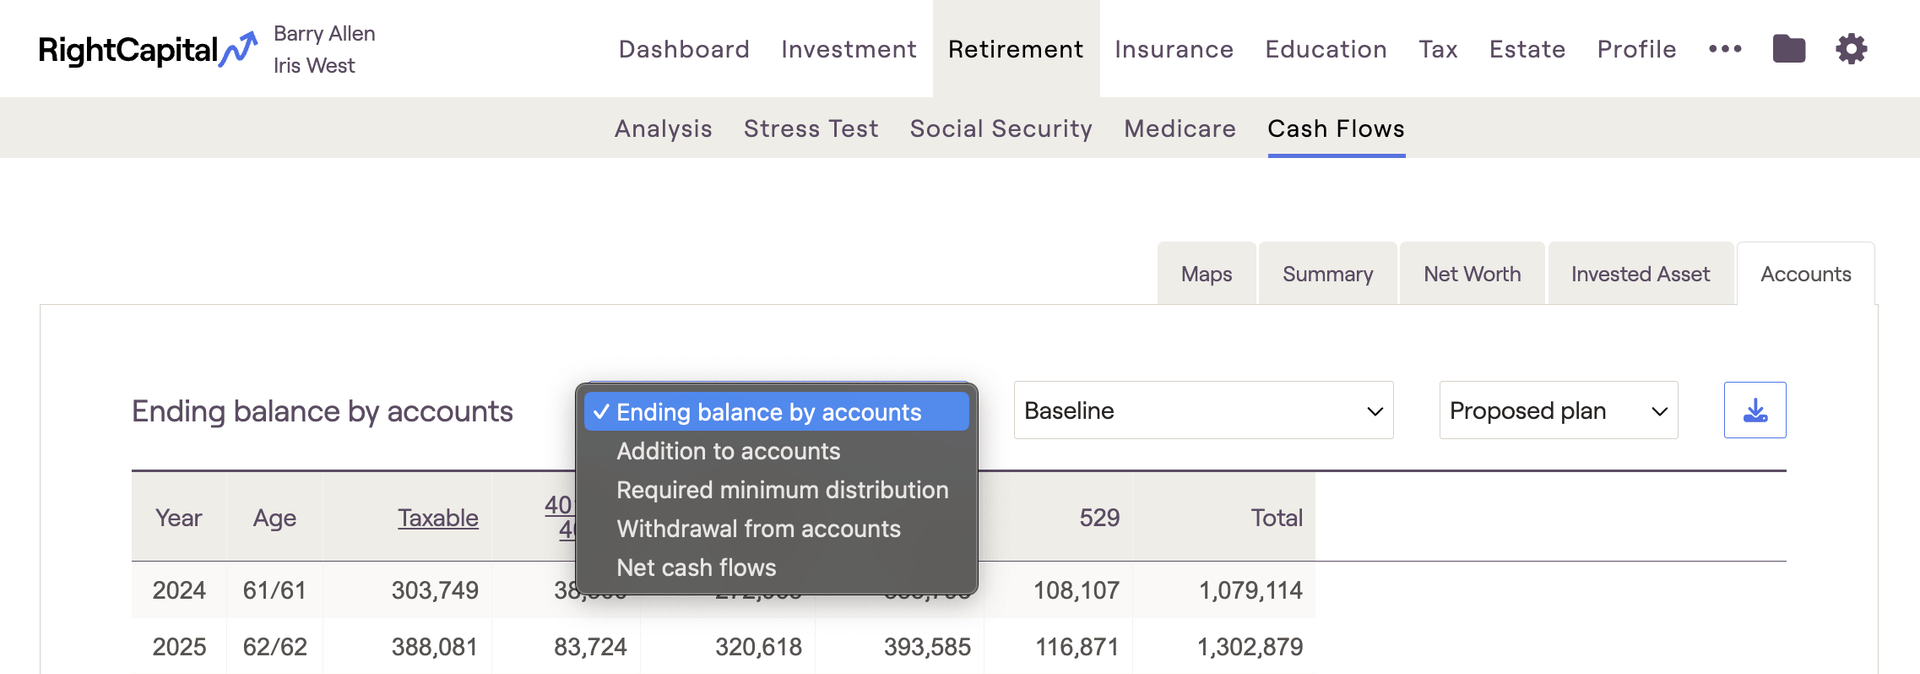
Accounts | Definition |
|---|---|
Ending balance by accounts | The end of period balance for each type of account - the Total will tie to the Ending Balance on the Invested Asset tab. |
Addition to accounts | All contributions (including planned saving, employer contribution, and saving to taxable accounts) to each type of account. |
Required Minimum Distribution | Reflects the required distribution of assets from tax-deferred accounts into the taxable account when the client reaches RMD age. |
Withdrawal from accounts | Reflects withdrawals from each account type to fund negative cash flows. |
Net cash flows | Reflects the total of Addition to accounts, Required minimum distribution, and Withdrawal from accounts for each account type. |
Options Tab

Options | Definitions |
|---|---|
New Grant | The year when shares of stock options or units are granted to an employee. |
Shares Vested | The volume of shares that vest in that year. This is when the client takes ownership of the stock that was granted to them. |
Shares Exercised | The volume of shares that are exercised in that year. This is when the client purchases the shares of stock that have vested. |
Vested and Exercisable Shares | Reflects shares that have vested but not exercised. |
Unvested Shares | Reflects shares that have been granted, but not yet vested. |
Shares Sold | Reflects the number of shares sold in a given year. |
Shares Held | Reflects the number of shares exercised, but not yet liquidated. |
Cost of Exercise | Equals shares sold times the strike price. |
Sale Proceed | Equals the shares exercised multiplied by the current price per share. Please note, the growth applied to the current price can be set within the Stock Plan plan on the Profile > Net Worth tab. |
Net Cash Flow | Reflects the difference between the sale proceeds and the cost of exercise. |
Ordinary Income | Income that is taxed at the marginal tax brackets. |
Short-term Gain | A gain from stock that has been owned for one year or less. Taxed as Ordinary Income. |
Long-term Gain | A gain from stock that has been owned for longer than 12 months. Uses its own tax brackets. |
Additional Information
In the upper right-hand corner, you can choose which plan you wish to view the Cash Flow details for - Current, Proposed, or any additional plans you have added. You can also choose how many cash flow rows will be displayed at once using the drop-down box in the lower right-hand corner:
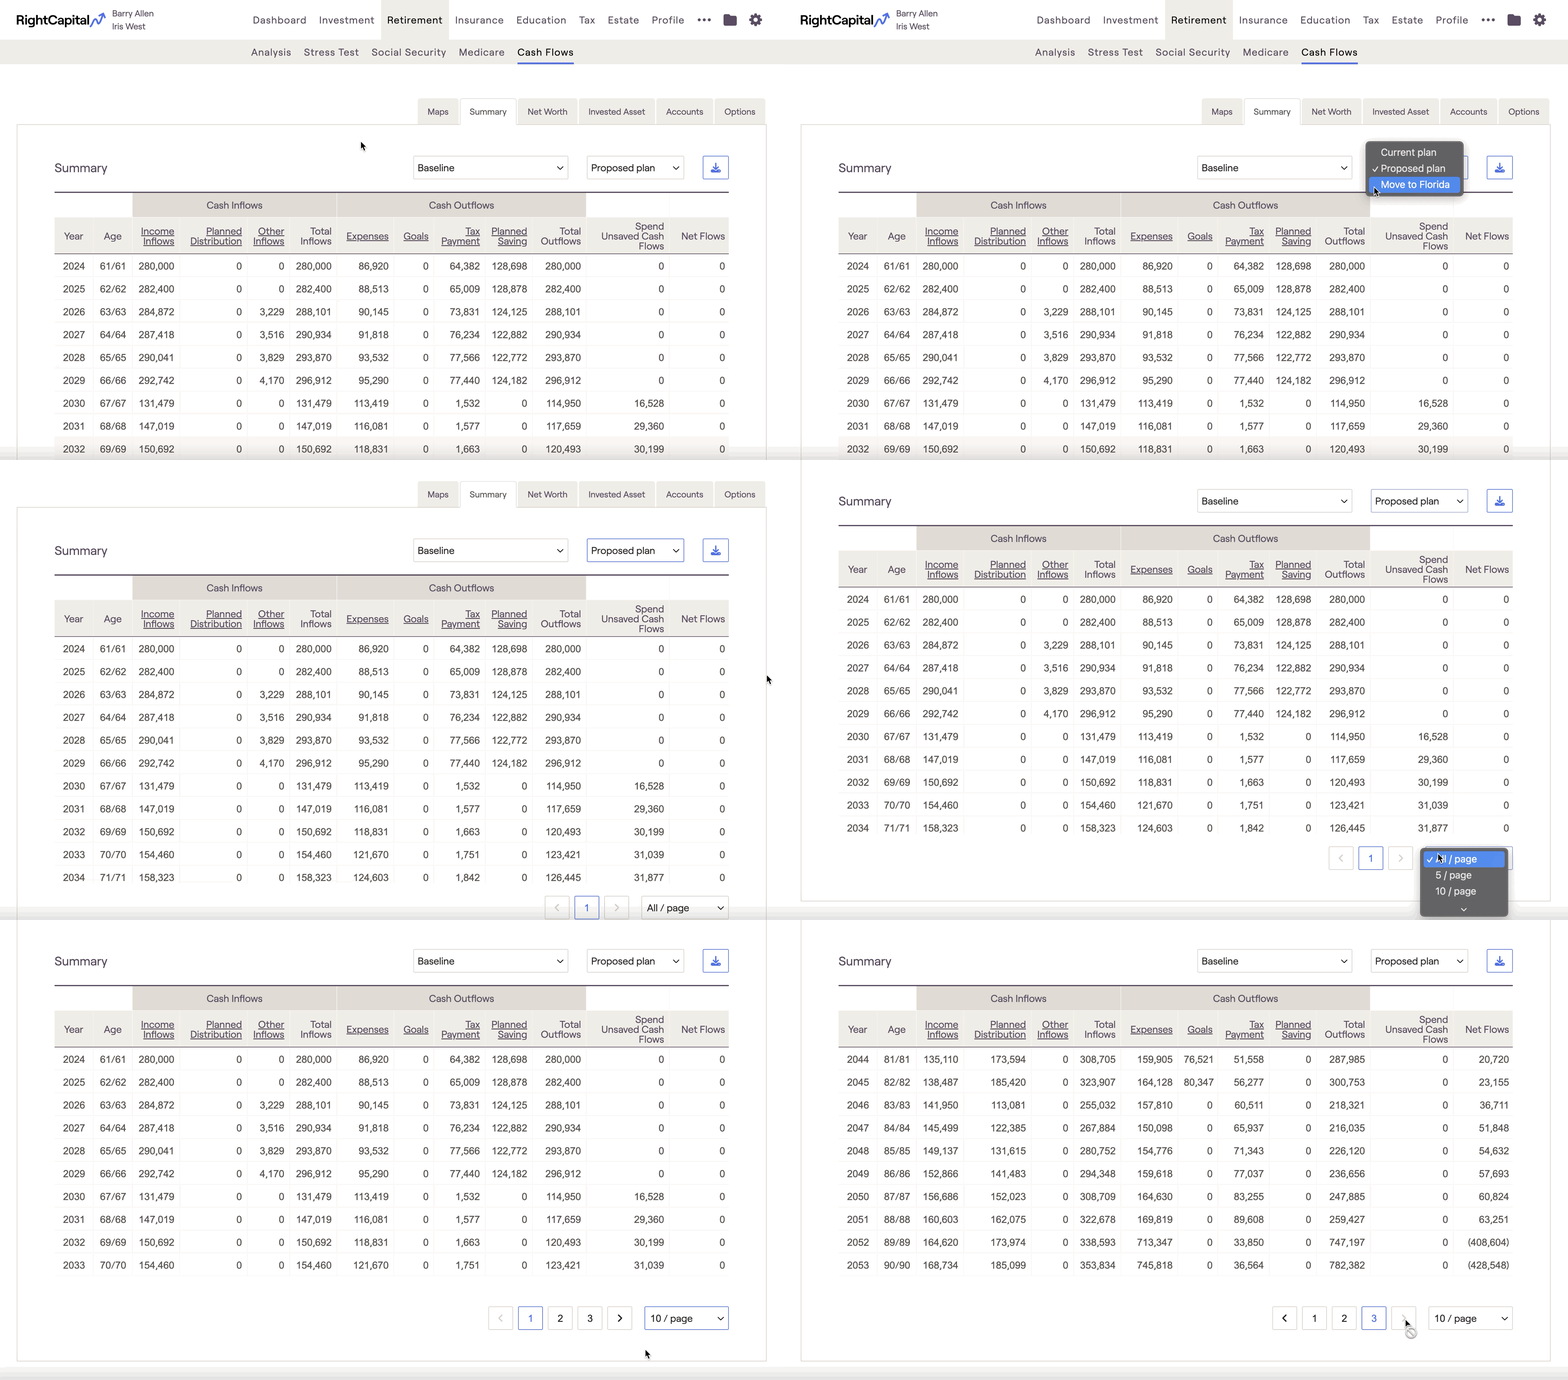
You can use the arrows and numbers to the left of the drop-down box to show additional cash flow pages if you are not displaying 'all years'. If there are more than ten years per page, you can use the scroll bar at the right of the cash flow numbers to scroll up or down.
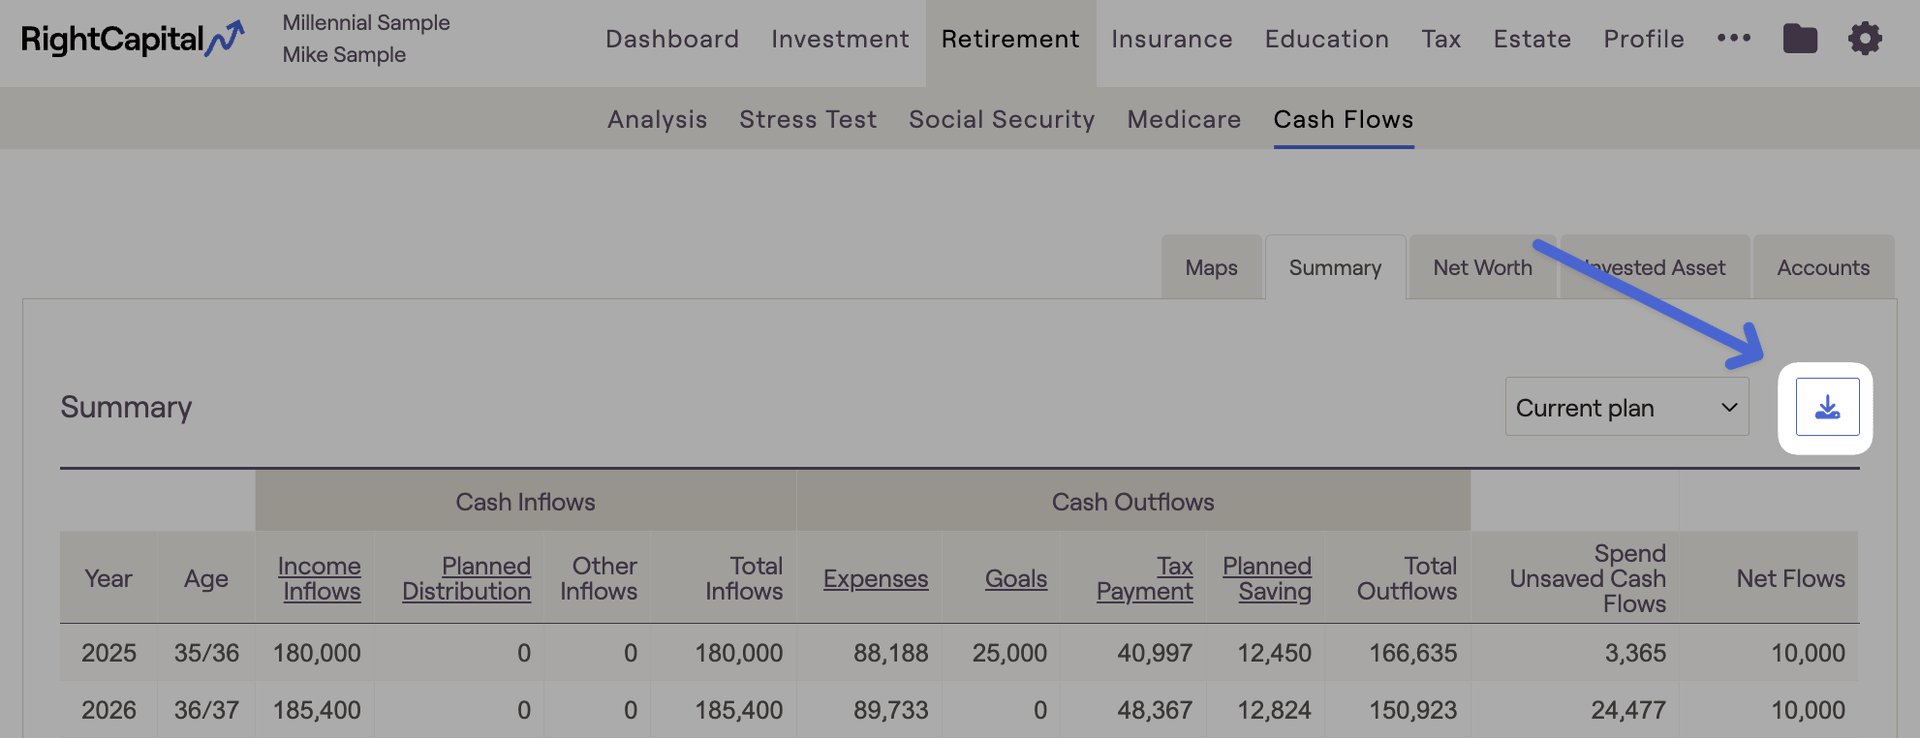
Within the cash flows, you can click the blue download button in the upper right corner to download the table you are currently looking at as a .csv file. This will allow you to open that cash flow table as an excel spreadsheet:
With this setting checked, you'll find a new dropdown menu in the cash flows that allows you to choose between the 'Baseline' projection, and any of your custom return scenarios. The baseline scenario will reflect a straight-line growth projection, whereas the custom scenarios will reflect fluctuating, pre-built sequences of return each year.
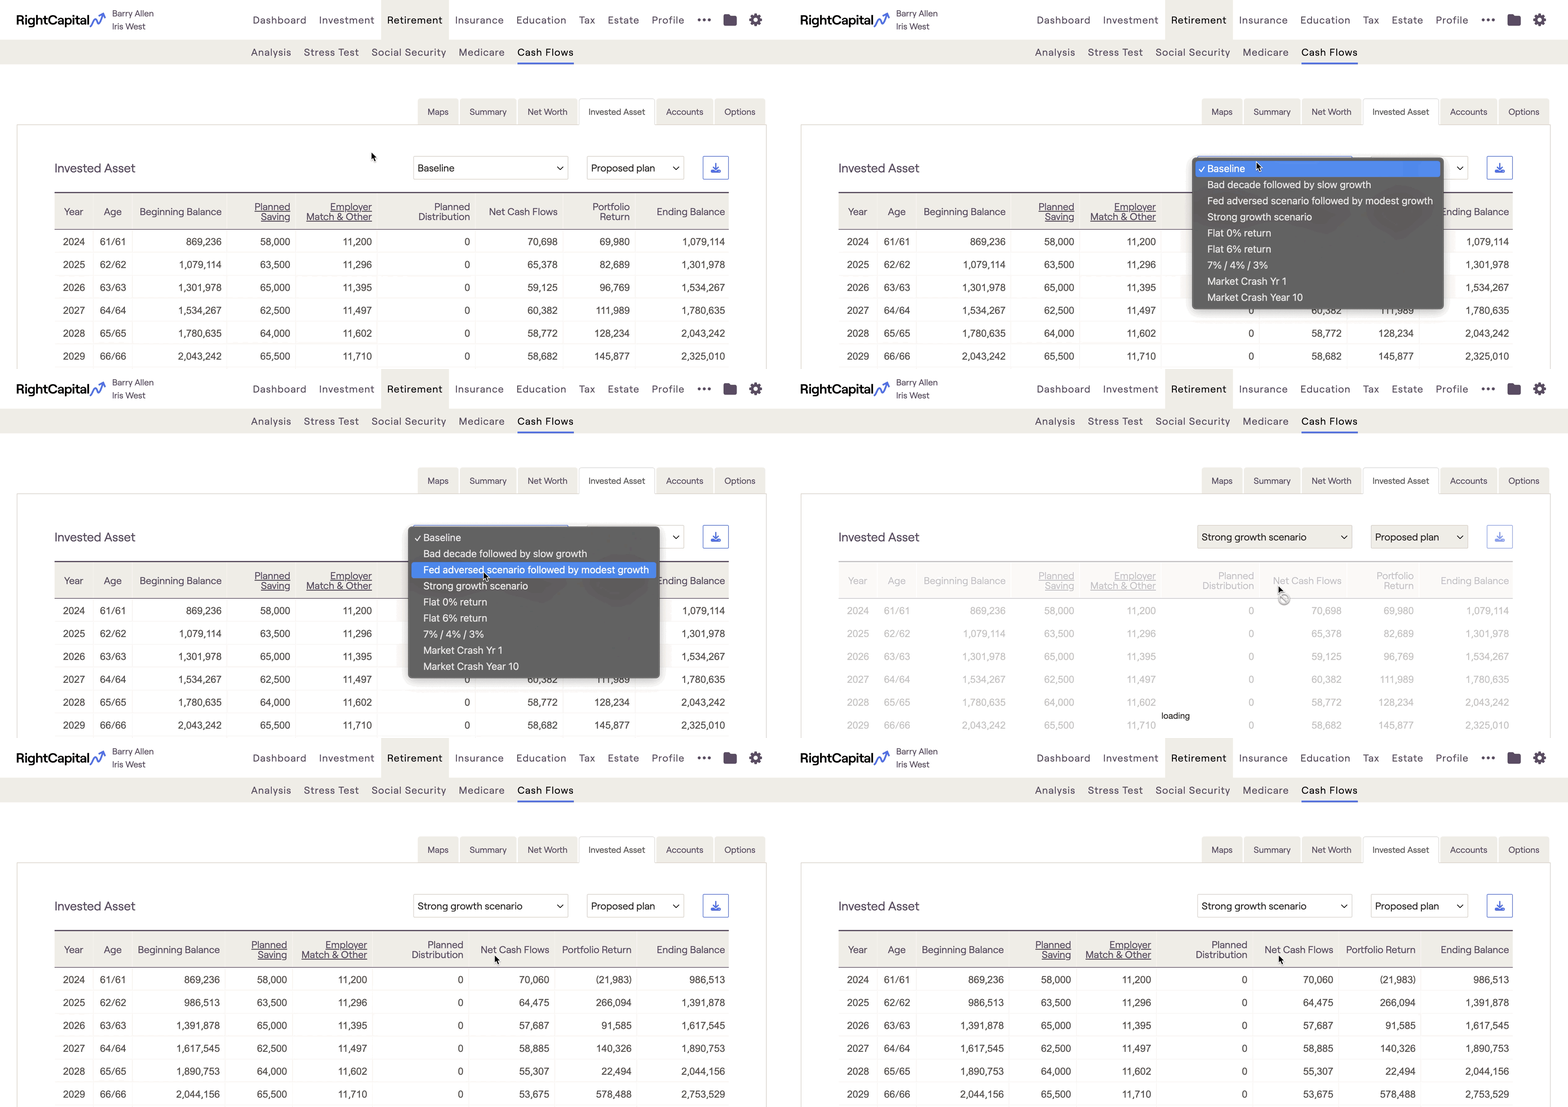
To learn more about custom return scenarios in RightCapital, you can visit our Return Scenarios - Knowledge Base article.
