You will also see two tabs on the insurance screen with the names of the client and co-client. The tab labeled with the client's name illustrates the scenario in which the client becomes disabled tomorrow; the tab labeled with the co-client's name illustrates the scenario in which the co-client becomes disabled tomorrow. In each tab, users can choose between two graphs by changing the dropdown menu on the right.
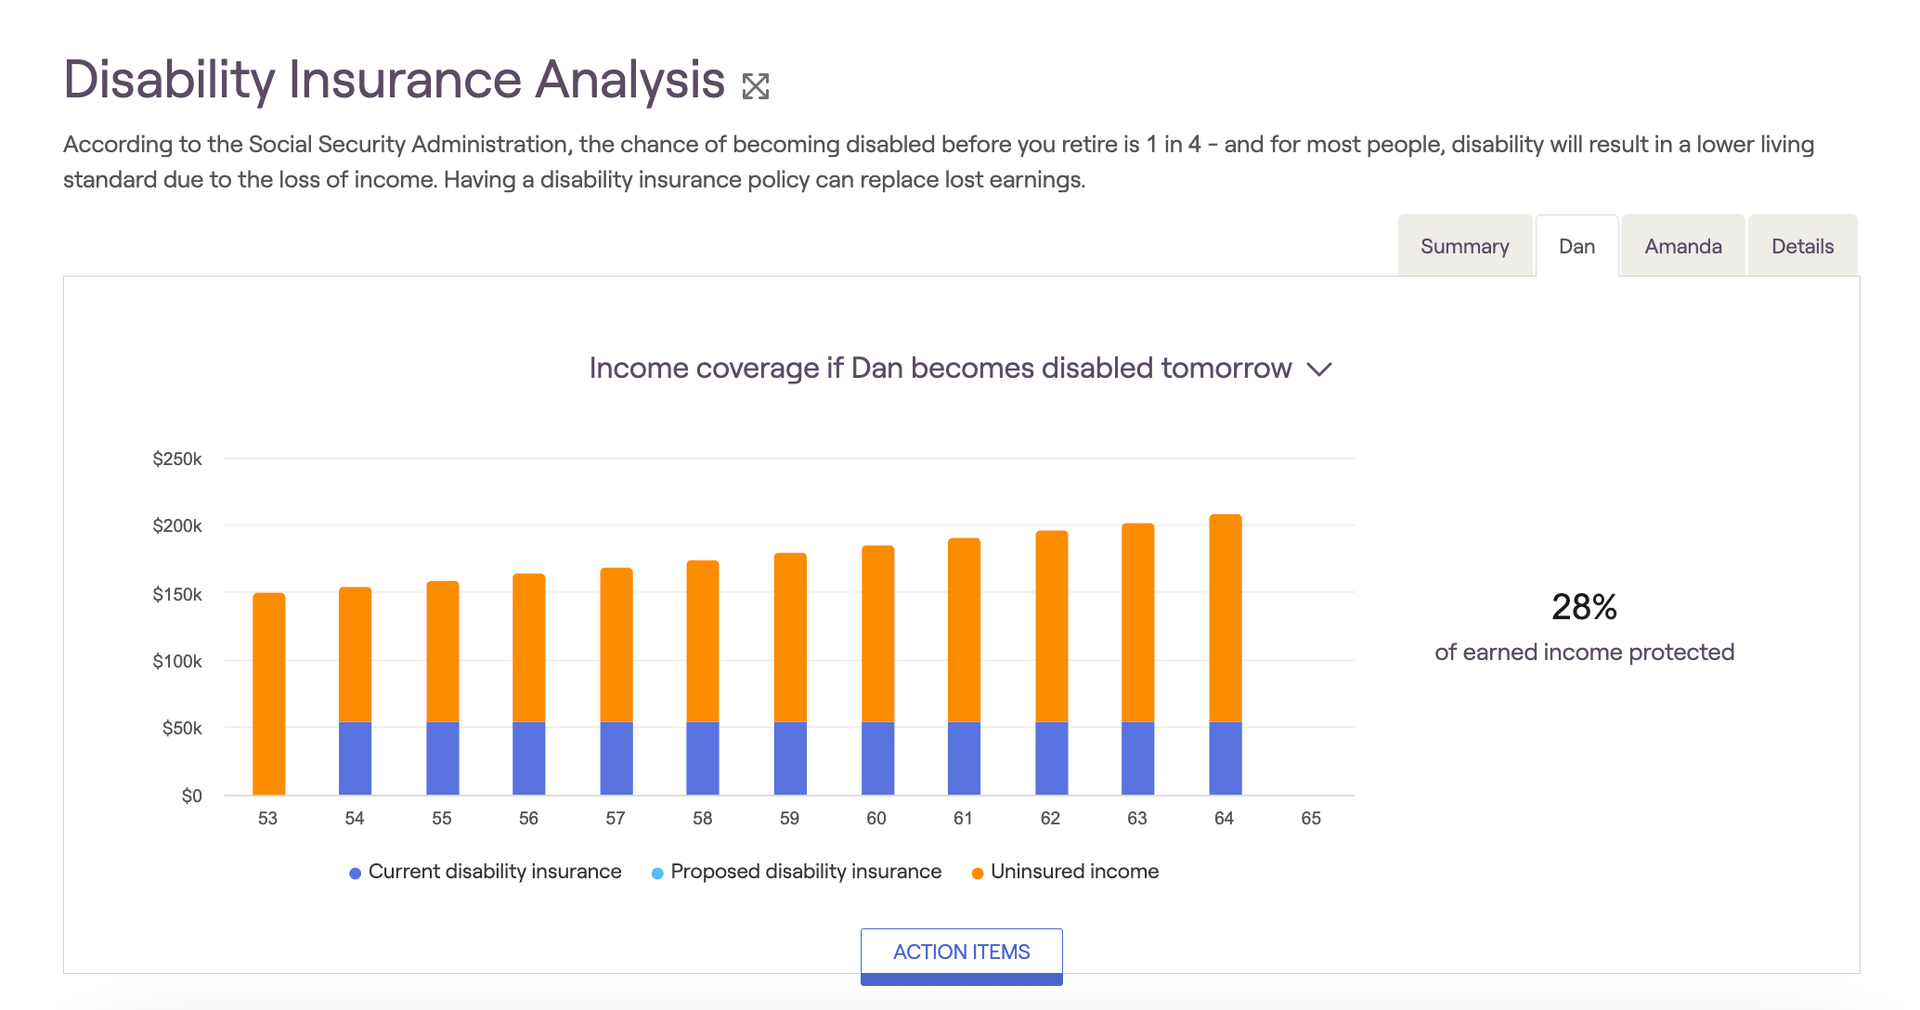
- The Income Coverage bar graph reflects the annual, covered, and uninsured income by year for each scenario. Uninsured income is listed in orange, and the total percentage of insured income is displayed to the right of the chart. This projection includes any current and proposed additional insurance indicated in the Action Items section.
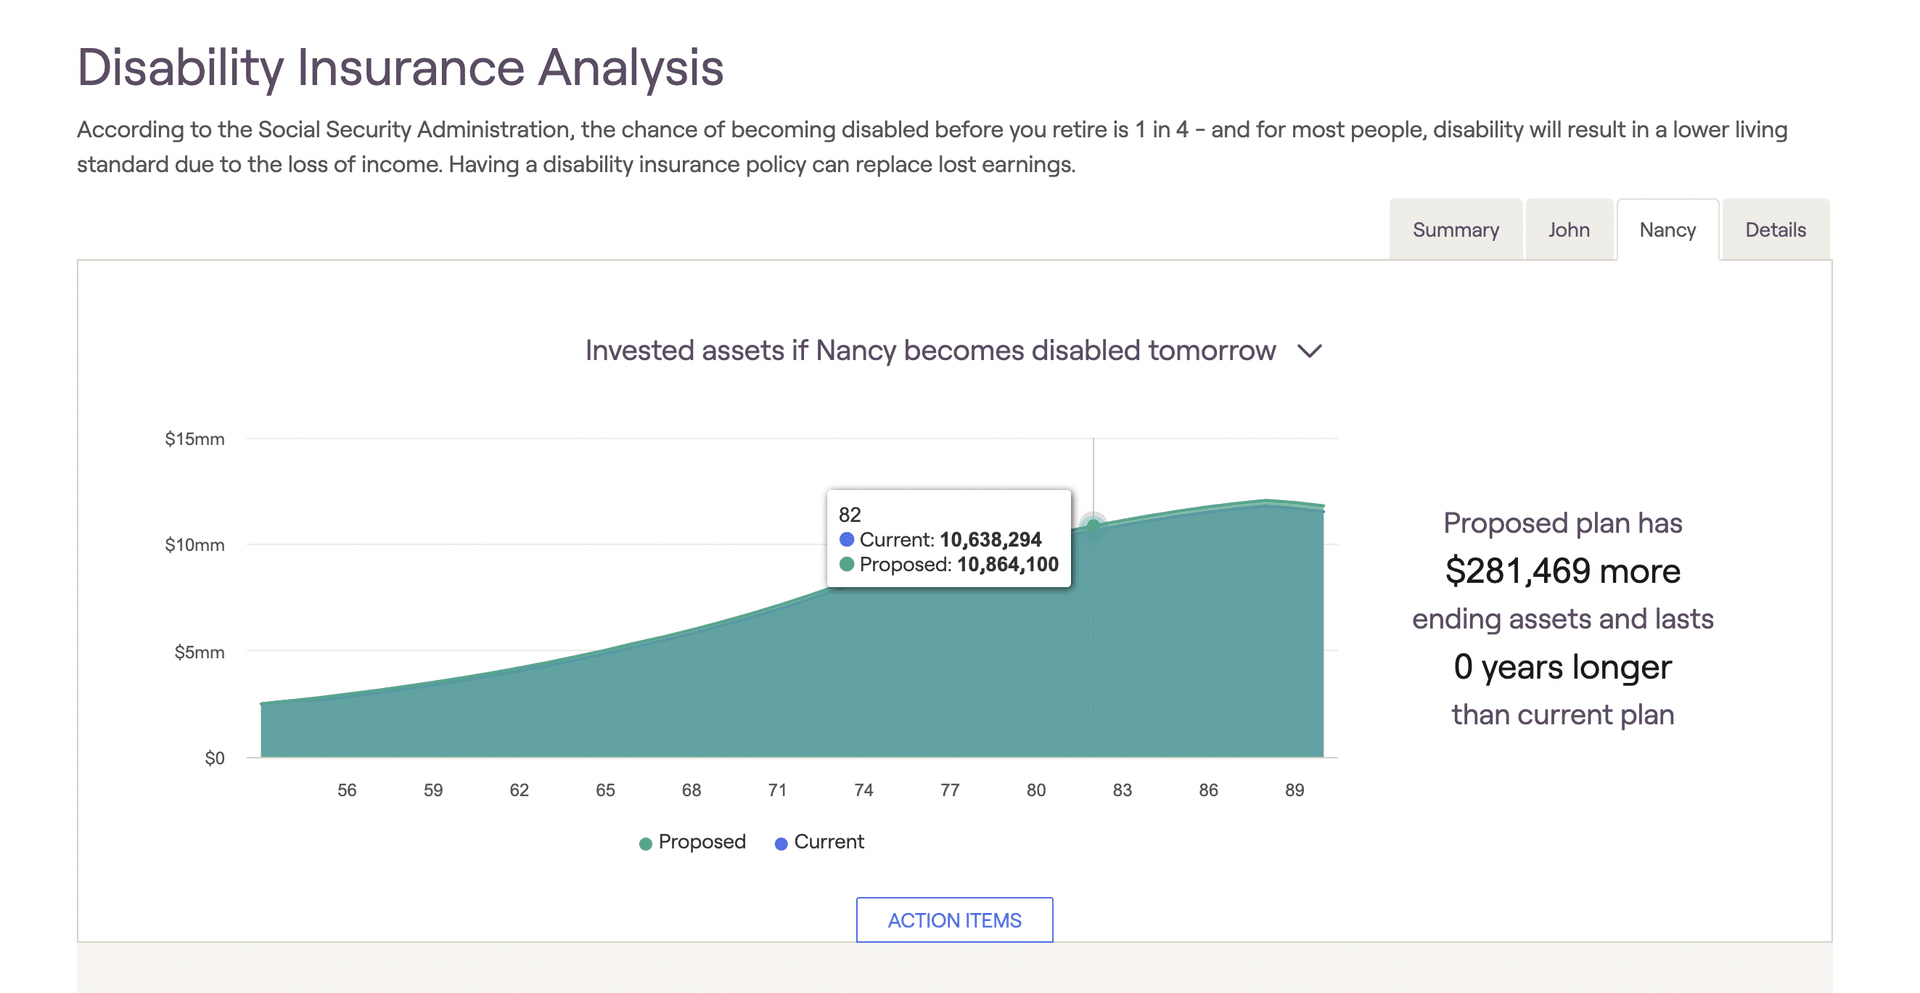
- The Invested Assets graph illustrates the impact on investments after a disability scenario arises. The chart displayed in blue shows the projection before including any proposed additional insurance; the chart in green shows the projection including the proposed additional insurance.