Tailor Global Asset Returns in RightCapital

When dialing in your asset return assumptions, each asset class allows you to specify the Interest, Dividend and Capital Gain percentages, which make up the Total Return for that asset class. You can customize the percentages for each field, or choose to use an available preset.

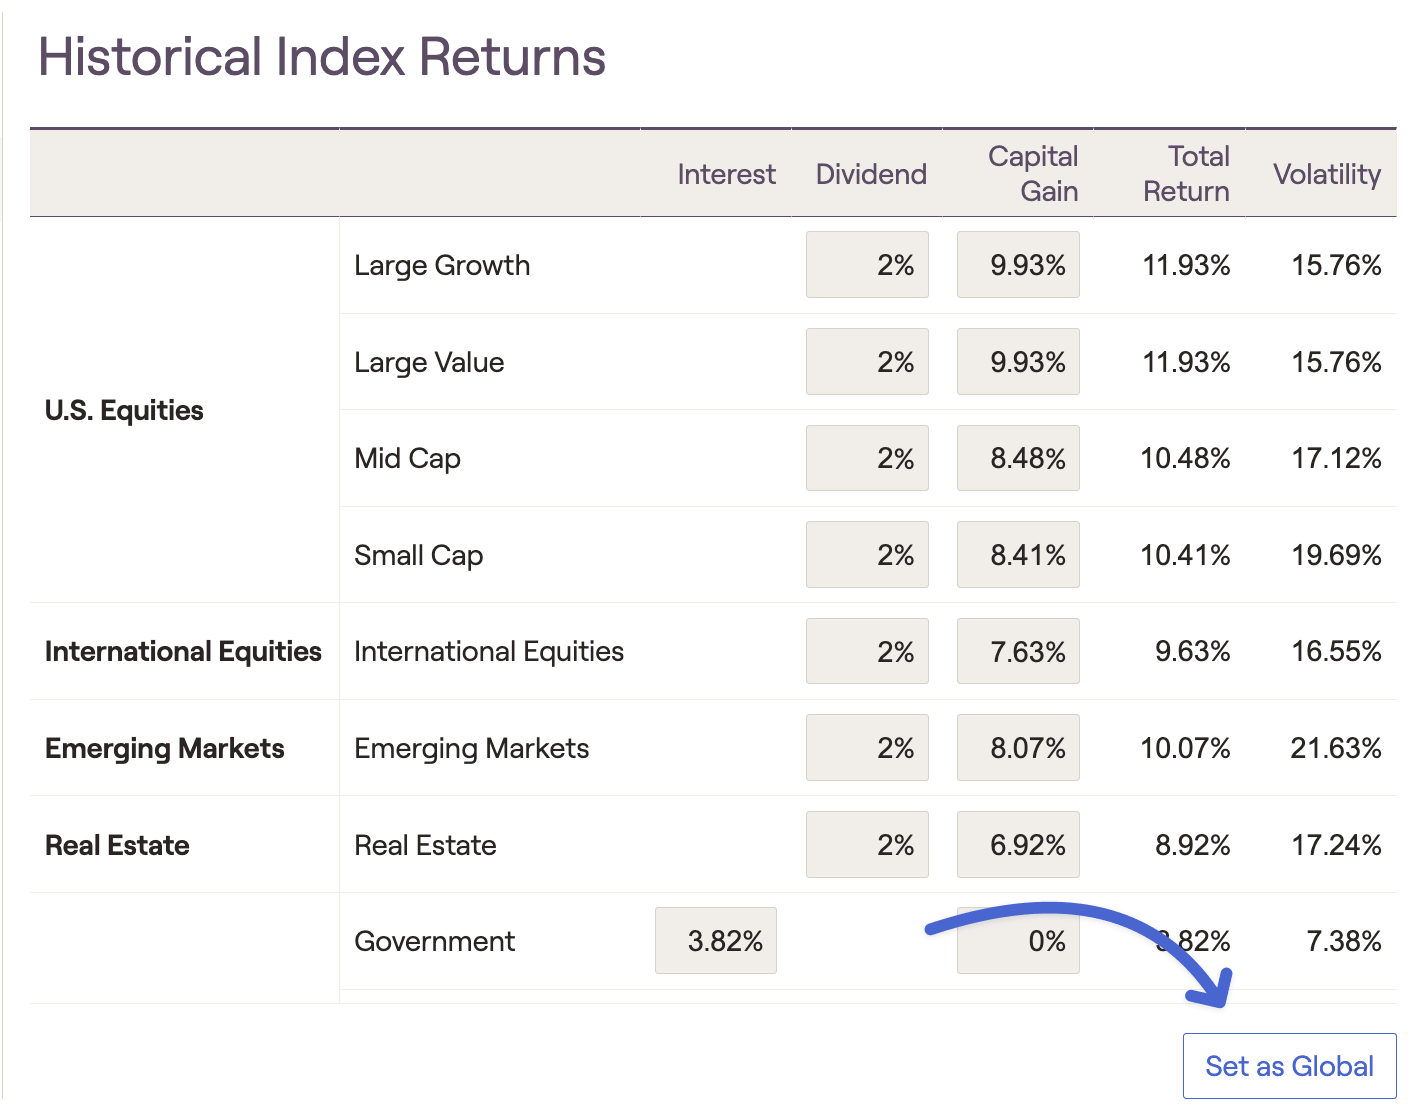
Historical Index Returns
The Historical Index Returns for 2026 can be found in the table below, along with the index and timeframe used for each individual asset class:
Asset Class | Interest | Dividend | Capital Gain | 2026 Total Return | Index Data Used |
|---|---|---|---|---|---|
Large Growth | 2.00% | 9.93% | 11.93% | S&P 500 Total Return Index: Dec 1975 - Dec 2025 | |
Large Value | 2.00% | 9.93% | 11.93% | S&P 500 Total Return Index: Dec 1975 - Dec 2025 | |
Mid Cap | 2.00% | 8.48% | 10.48% | Russell Midcap Index: Dec 1995 - Dec 2025 | |
Small Cap | 2.00% | 8.41% | 10.41% | Russell 2000 Index: Dec 1980 - Dec 2025 | |
International Equities | 2.00% | 7.63% | 9.63% | MSCI EAFE Index: Dec 1975 - Dec 2025 | |
Emerging Markets | 2.00% | 8.07% | 10.07% | MSCI Emerging Market Index: Dec 1987 - Dec 2025 | |
Real Estate | 2.00% | 6.92% | 8.92% | MSCI US REIT Index: Dec 2009 - Dec 2025 | |
Government | 3.66% | 0% | 3.82% | 10 Year Treasury Bond: Dec 1999 - Dec 2025 | |
Municipal | 4.22% | 0% | 4.22% | Bloomberg Municipal Bond Index: Dec 1999 - Dec 2025 | |
Corporate | 3.94% | 0% | 4.06% | Bloomberg US Aggregate Bond Index: Dec 1999 - Dec 2025 | |
High Yield | 6.41% | 0% | 6.49% | ICE BofA US High Yield Index: Dec 1999 - Dec 2025 | |
International Bonds | 3.94% | 0% | 4.06% | Bloomberg US Aggregate Bond Index: Dec 1999 - Dec 2025 | |
Cash | 1.79% | 0% | 1.87% | 3 Month Treasury Bill: Dec 1999 - Dec 2025 | |
Other | 2.00% | 9.93% | 11.93% | Use S&P 500 as Proxy |
Forward-Looking Assumptions
The chart below summarizes the information from JP Morgan's Long-Term Capital Market Assumptions. You can find more details here .
Asset Class | Interest | Dividend | Capital Gain | 2026 Total Return |
|---|---|---|---|---|
Large Growth | 2% | 4.70% | 6.70% | |
Large Value | 2% | 4.70% | 6.70% | |
Mid Cap | 2% | 5.00% | 7.00% | |
Small Cap | 2% | 4.90% | 6.90% | |
International Equities | 2% | 5.80% | 7.80% | |
Emerging Markets | 2% | 5.80% | 7.80% | |
Real Estate | 2% | 6.20% | 8.20% | |
Government | 4.00% | 0% | 4.00% | |
Municipal | 3.80% | 0% | 3.80% | |
Corporate | 5.20% | 0% | 5.20% | |
High Yield | 6.10% | 0% | 6.10% | |
International Bonds | 4.00% | 0% | 4.00% | |
Cash | 3.10% | 0% | 3.10% | |
Other | 2% | 4.70% | 6.70% |
Customized Return Scenarios

You can also delete return scenarios by selecting the 3 dots icon and selecting "delete". The system will ask you to confirm by selecting what returns plans using the deleted model should switch to:

Return Assumption Considerations
Asset return assumptions are a critical component of each and every financial plan, having an impact on tax calculations as well as future growth on invested assets. It is generally recommended to review and update your return assumptions periodically, to ensure robust projections and provide the most value to your clients.
Historical Return Assumptions operate on the premise that historical performance provides reasonable insight into future performance. Using historical data to set return assumptions provides a systematic approach that factors evidence based return expectations into your financial projections.
Forward-Looking Assumptions typically rely only partially on historical data, in combination with expert analysis of current events and other macroeconomic factors. Using forward-looking assumptions is a more modern approach, allowing you to incorporate greater subjectivity into your projections.
In practical terms, the Historical preset in RightCapital is generally more optimistic than the Forward-Looking preset. Most plans will see a higher probability of success with Historical assumptions, and a lower probability with Forward-Looking.
Household Specifc Return Assumptions

If your firm has opted to lock in a set of firm-wide return assumptions for all advisors in your organization, you will not have the ability to adjust global or client-specific return assumptions. If this is the case, any questions or requests to change return assumptions should be directed to the administrator of your firm.